


USD/CAD
The United States dollar continues to rally against the Canadian dollar as it has broken above the 1.43 level and is now threatening a major area of noise between 1.43 and 1.45. Short-term pullbacks continue to be a potential buying opportunity, but at this juncture, the one thing that seems to be driving this market more than anything else will be the interest rate differential between the United States and Canada.
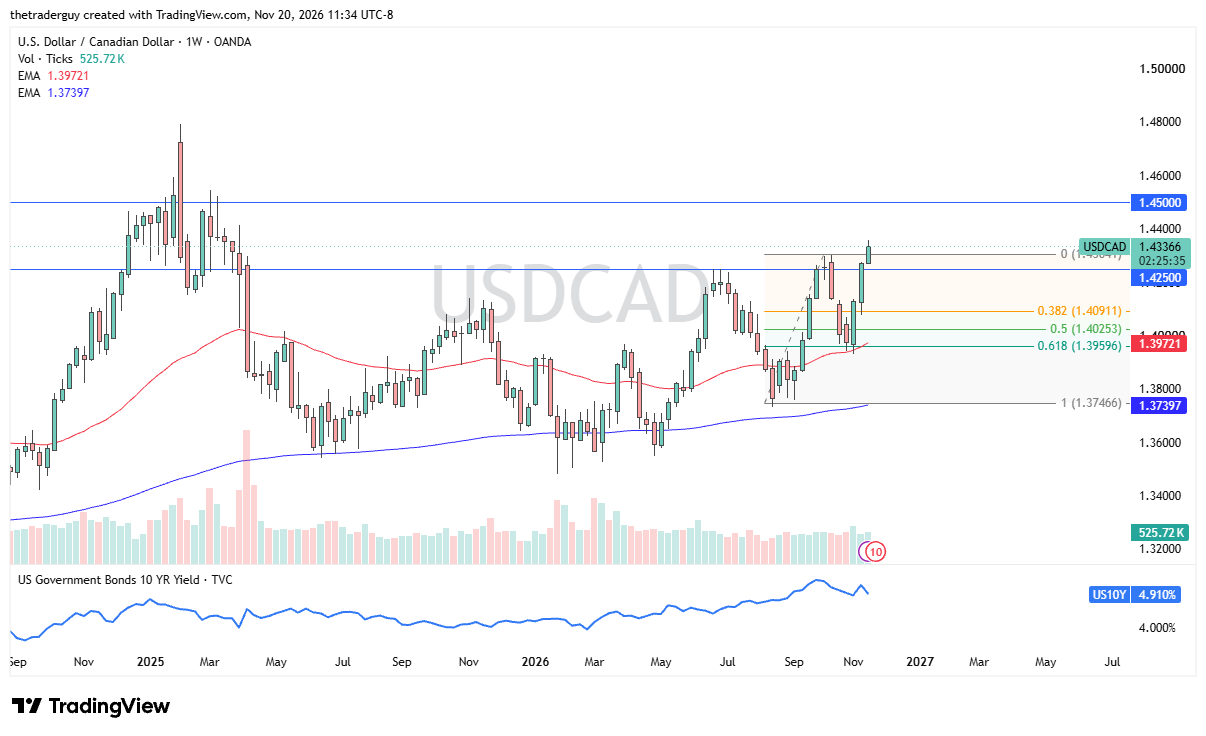
Furthermore, the Canadian market has to deal with oil being fairly soft, and of course, the market makes a certain amount of sense that the overall attitude of this is still one that there are plenty of buyers waiting to get involved and take advantage of value as it occurs.
EUR/USD
The euro has broken below the crucial 1.10 level, an area that's a large, round, psychologically significant figure and an area that a lot of people will be watching. After that, we could be looking at the 1.08 level. Short-term rallies, I think, open up the possibility of shorting opportunities at the first signs of exhaustion.
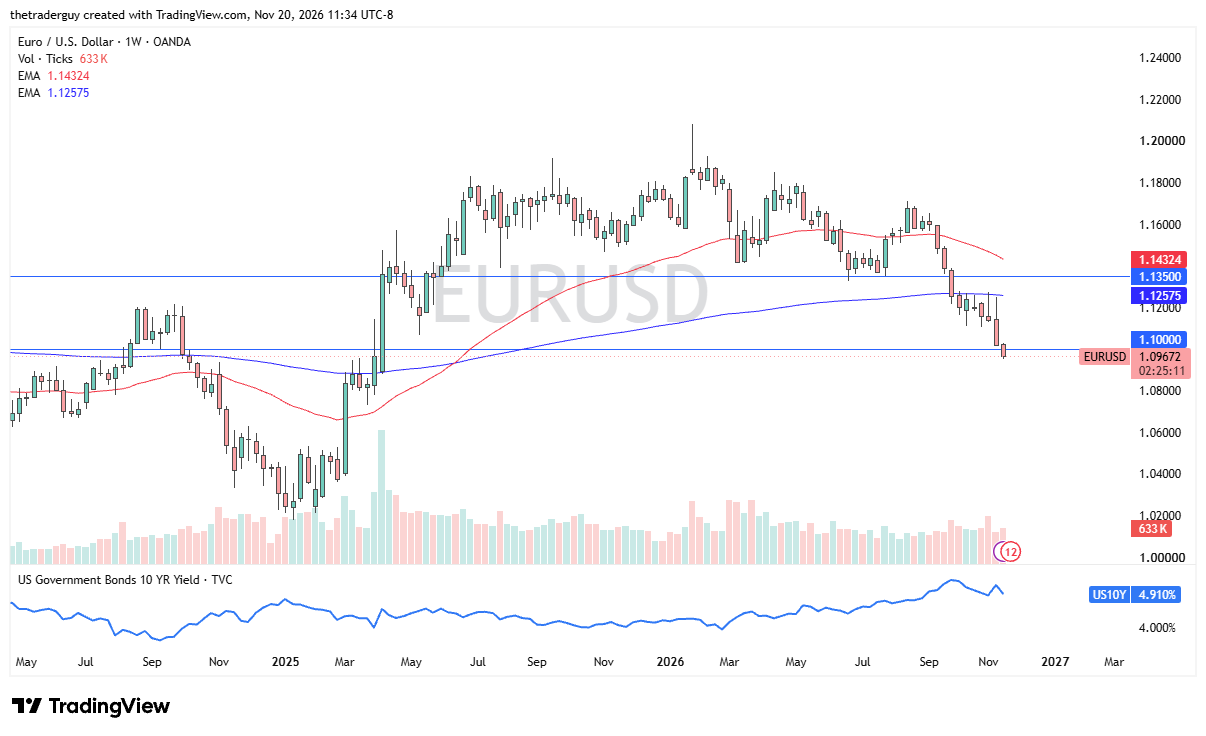
The euro has to worry about the interest rate differential favoring the United States, but also has to worry about energy problems overall. After all, the Europeans may have some issues when it comes to procuring energy over the winter.
Top Regulated Brokers
Gold
The gold market has absolutely gotten crushed during the week, and it finds itself sitting just above the crucial $3,500 level. The $3,500 level is an area that a lot of people will be watching due to the previous resistance barrier from trading back in the early part of 2025.
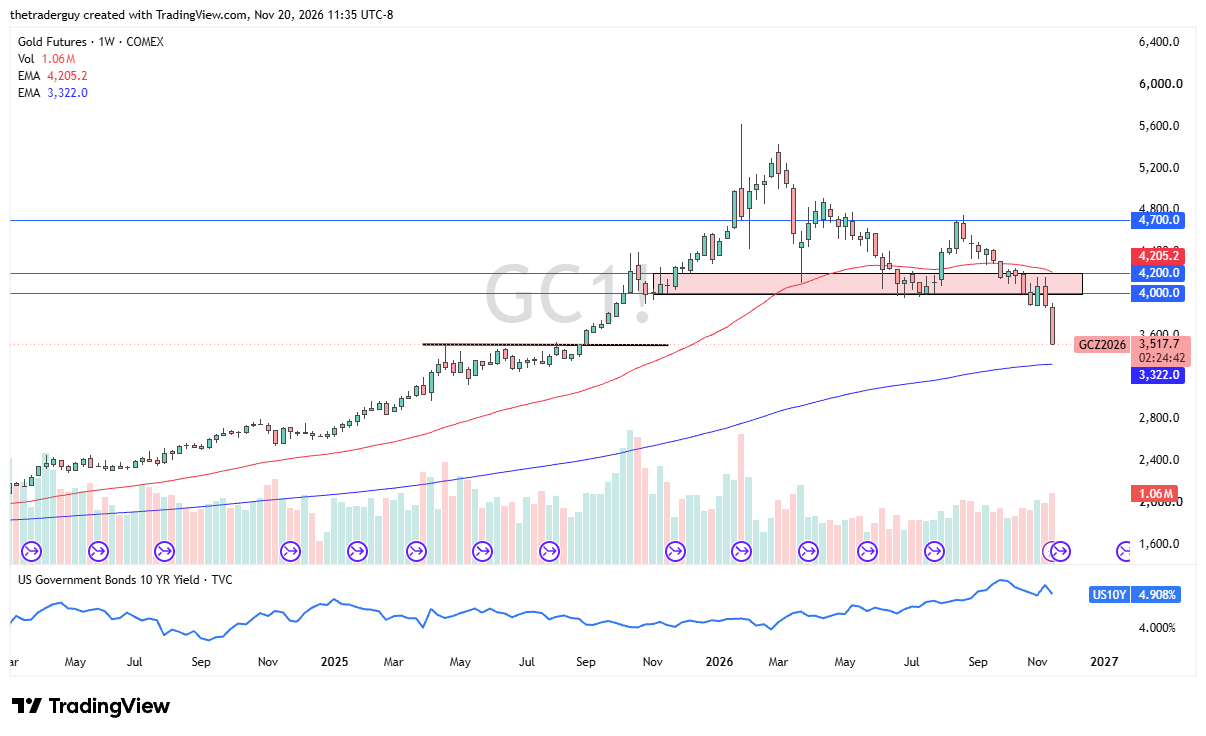
There's no sign of life here in the gold market, and as long as the real rates continue to be positive in the United States, it makes non-yielding assets such as gold much less attractive. This is a horrible-looking chart, and I suspect rallies at this point in time will end up being potential selling opportunities at the first signs of serious trouble.
Silver
The silver markets have collapsed as well, as they are sitting just above the $41 level heading into the weekend and, quite frankly, can't seem to catch a bid. We sliced through the $45 level, and the previous week even broke down below the $50 level for the third time in a month.
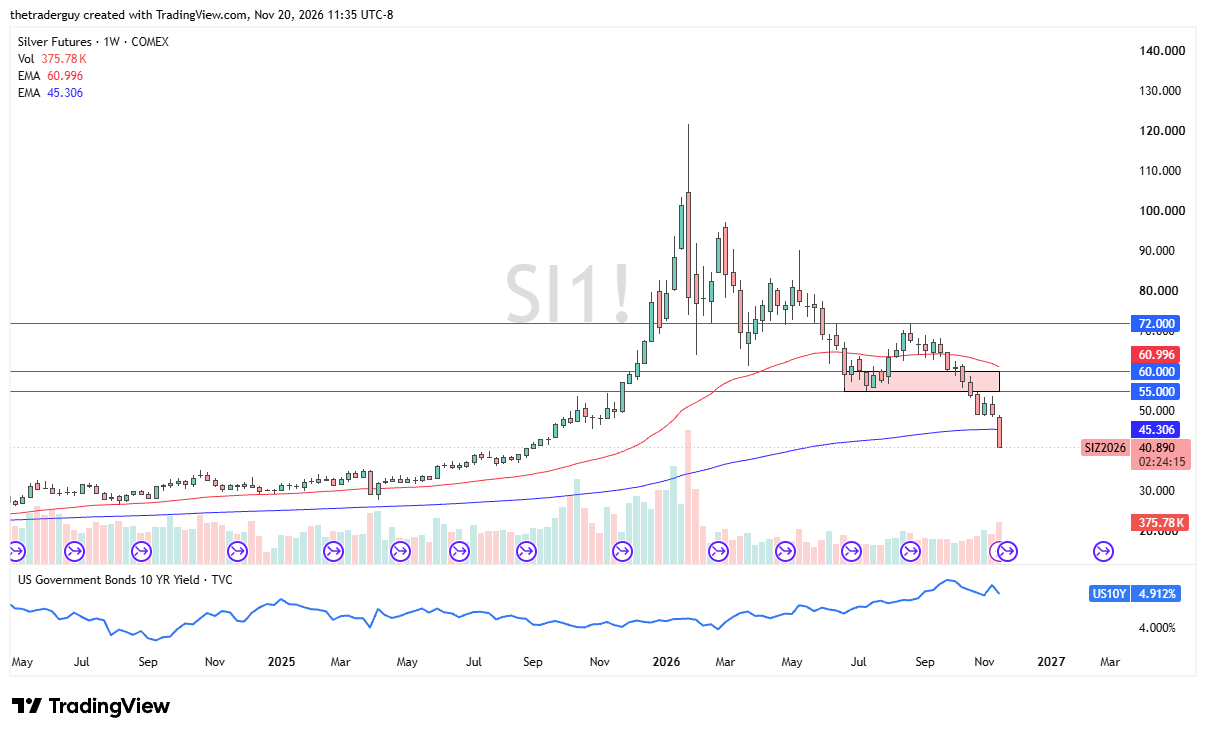
Ultimately, the market is one that is looking for some signs of hope out there, but unfortunately, as long as those real rates are positive, silver is an absolute disaster waiting to happen. Longer term, I like silver, but ultimately there's no sign of life here.
WTI Crude Oil
The WTI crude oil market fell during the week as well, breaking down below the 61.8% Fibonacci retracement level from the move back in July. The 50-week EMA is in the same neighborhood, and it looks like the market is trying to respect $80 as a floor.
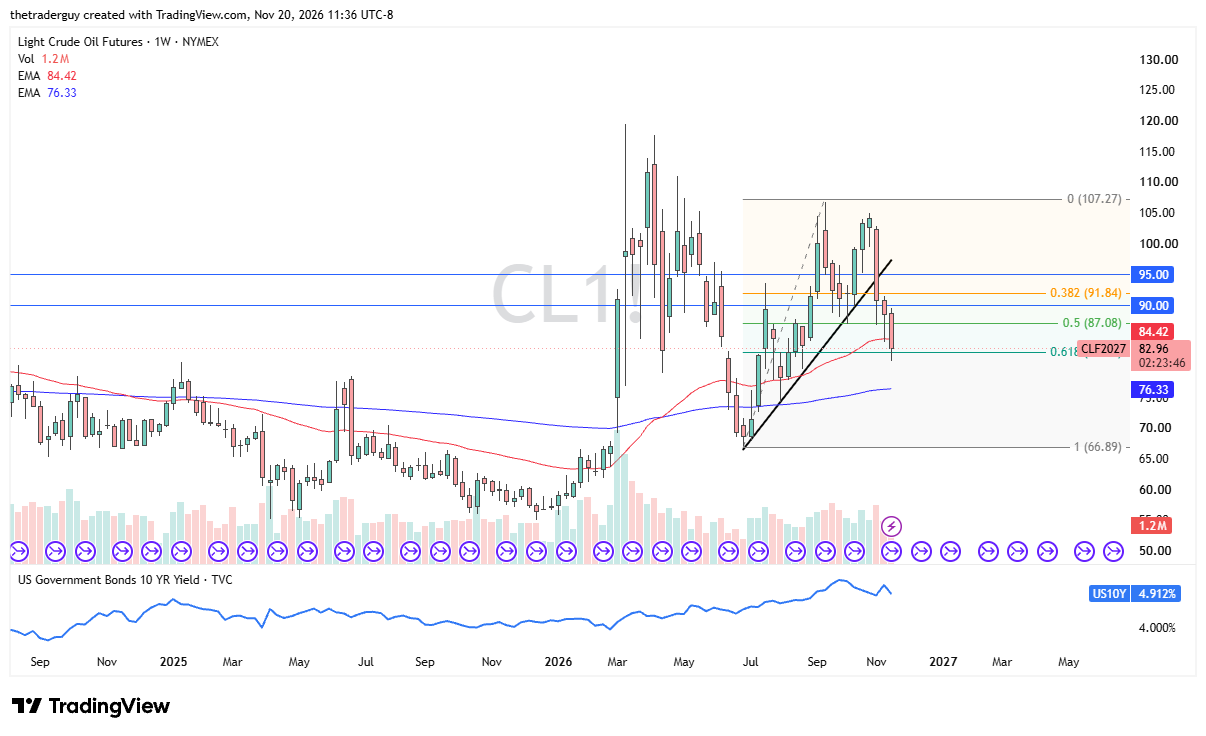
We continue to have a lot of questions asked about the supply of crude oil, but we also have to keep in mind that there are still tensions that could cause issues in the Middle East, and while it doesn't directly affect the WTI market, the carry-on effect could cause issues.
DAX
The DAX in Germany looks absolutely horrible. The candlestick for the week was absolutely brutal, and it looks like we are threatening the 24,500 level. The size of the candlestick is quite shocking, and if we see continuation to the downside, the next major support level is closer to the 23,500 level, possibly the 22,000 level.
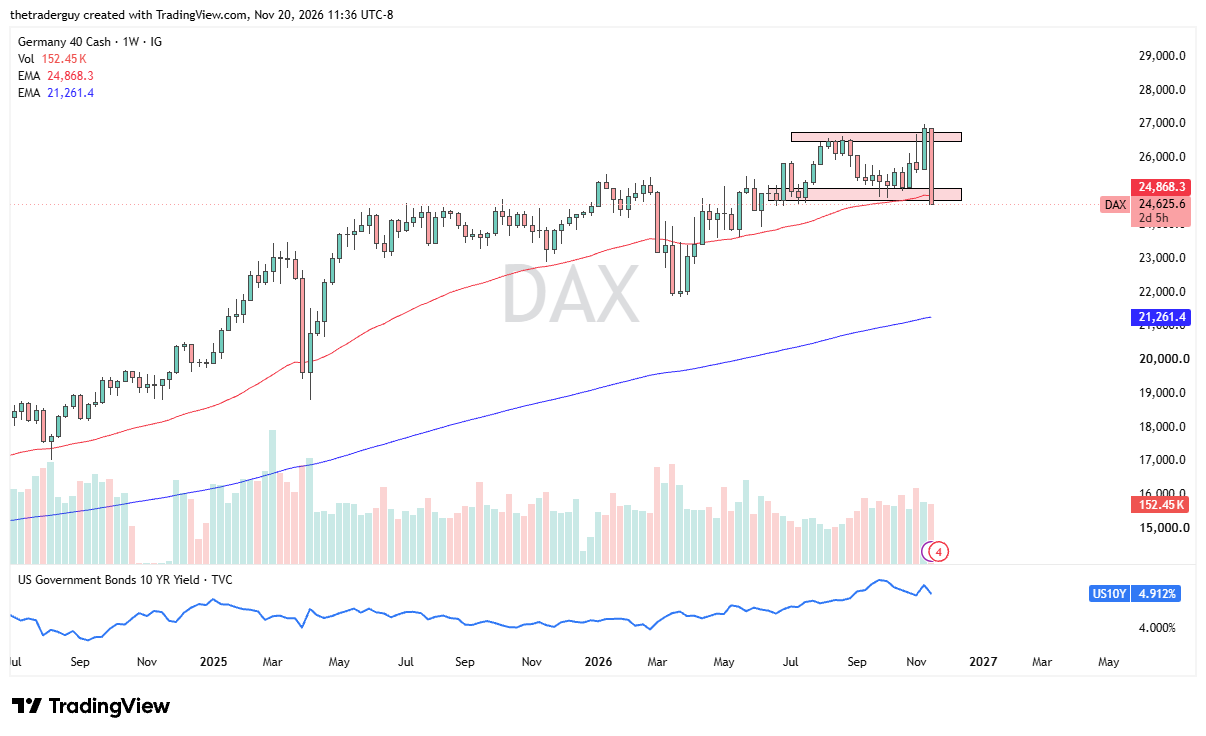
If the market were to rally from here, it could, in theory, at least stay in the same range that it had been in, but this is one of the poorest-looking candlesticks for the week as Germany continues to worry about energy and, quite frankly, the ECB is somewhat noncommittal as to its monetary policy.
NASDAQ 100
The Nasdaq 100 has collapsed as well for the week, and it looks like we simply don't have any real support at the moment, as there are still plenty of concerns about the AI trade and everything that's going on with NVIDIA.
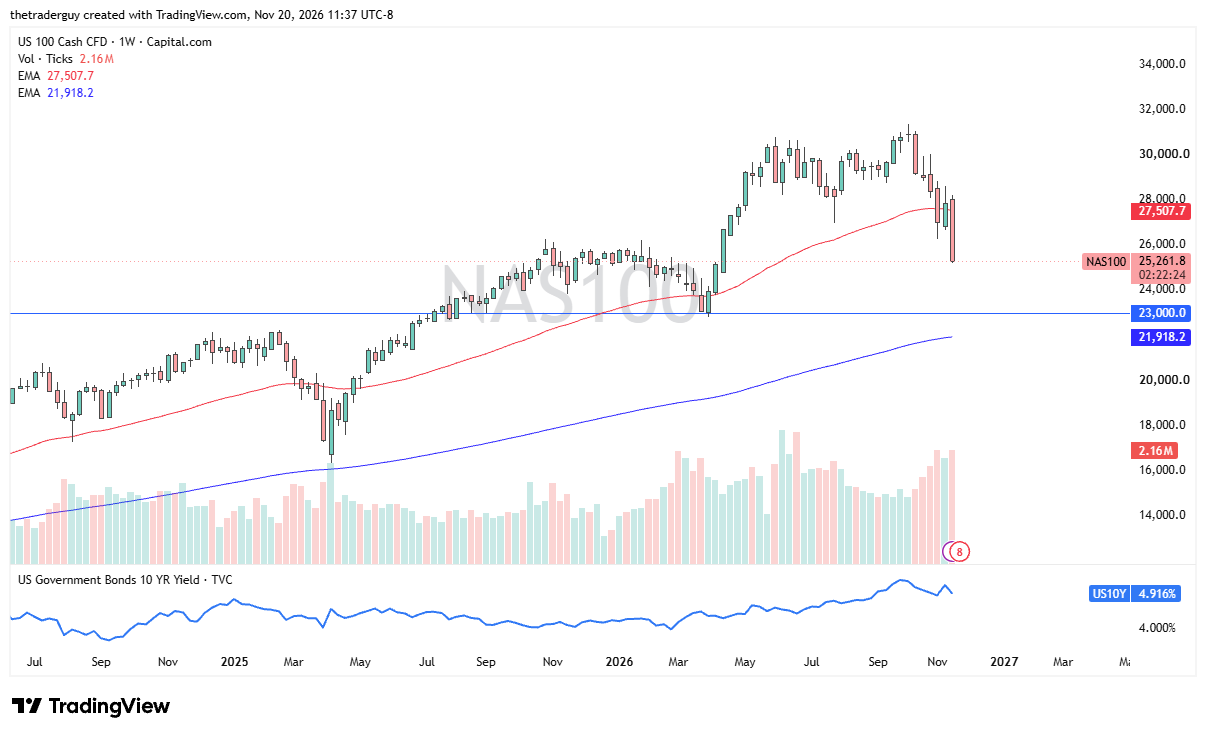
Overall, I do think eventually this market turns around, but those higher rates and the nonsense coming out of the NVIDIA investigations that paint the AI market in a certain light have been disastrous for the Nasdaq. Ultimately, I think rallies end up being selling opportunities, with the $23,000 level possibly the floor in the market.
Bitcoin
The Bitcoin market has broken down rather significantly as well, as we are now below the $60.000 level and testing major support going back to 2024. Quite frankly, in an environment where something like the Nasdaq can't get a bid, it's hard to imagine how Bitcoin would.
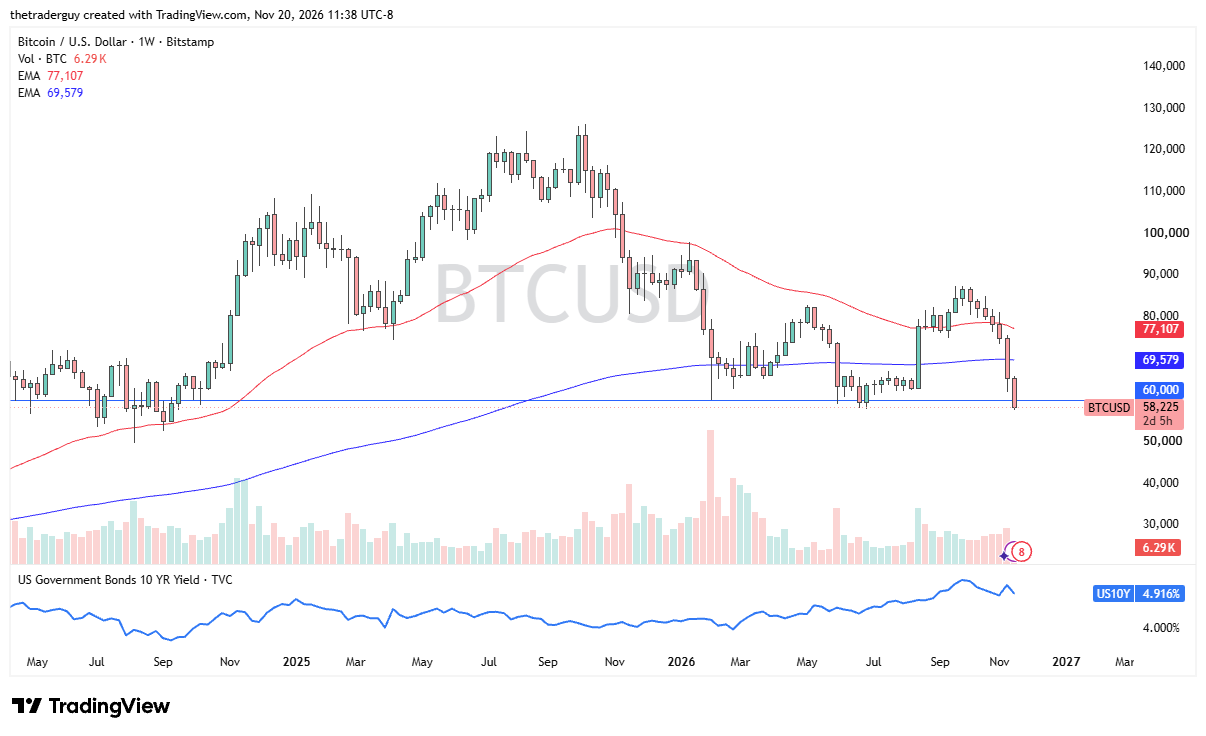
Bitcoin looks horrible. I believe at this point in time any rally that we get is likely going to be sold into at the first signs of exhaustion. Bitcoin remains very bearish.
Ready to trade our Weekly Forex forecast? Check out our list of the best Forex brokers.