


Markets are currently dominated by a strong US Dollar which is driving almost everything, whether stocks, commodites, or Forex. The AUD/USD currency pair has been no exception and has been continuing to move steadily lower over recent days. Is there any end in sight to this, and if not, how much lower might it go? Let's take a closer look.
Top Regulated Brokers
AUD/USD Fundamental Analysis
The Australian dollar’s fundamental outlook remains cautious, as markets increasingly expect the RBA’s tightening cycle to have peaked. Although the RBA raised its cash rate to 4.85% this month, today’s minutes highlighted a difficult balance between persistent inflation and the risk of a sharper economic slowdown, limiting support for the Aussie from its high interest rates. Weak domestic confidence and housing data add to the headwinds, leaving this week’s wages and employment releases important tests: stronger figures could revive expectations of further RBA tightening, while softer readings would reinforce the case for a prolonged pause and keep the currency under pressure.
The US dollar’s fundamental outlook remains bullish, supported by persistent inflation and expectations of further Federal Reserve tightening. However, expectations of a larger, 50-basis-point move have faded. Elevated US yields continue to underpin the currency’s appeal, while weaker risk appetite has added support. Today’s US retail sales release is the next important test: resilient spending would reinforce the case for restrictive policy, while a weak reading could lower yields and trigger dollar profit-taking after its recent rally.
It looks like fundamentals are supporting a case for a bearish outlook in this currency pair, although that could change somewhat today if the US Retail Sales data surprises.
AUD/USD Technical Analysis
My technical analysis bradly matches the fundamental analysis, which is a good sign for reliability – looking at a price chart, I would also categorise it as bearish. The price has been moving lower for more than two weeks, and over the past week or so, the action has mostly been contained within a narrow and fairly steep descending price channel represented by the linear regression analysis study drawn within the price chart below. This channelled descent printed five tightly clustered resistance levels which could be hard to break.
Where things get a little bit interesting is that over recent hours, the rhythm of the channel has been somewhat disrupted, and the price might finally be finding enough support at 0.6725 to break out of this channel. This support also has a couple of levels not far below it which might help strengthen it.
The price has also just reached a new 11-month low.
It seems we are seeing a bit more bullishness, or at least a potential end to the immediate bearishness. It might be that traders are simply positioning for the US Retail Sales data release due today.
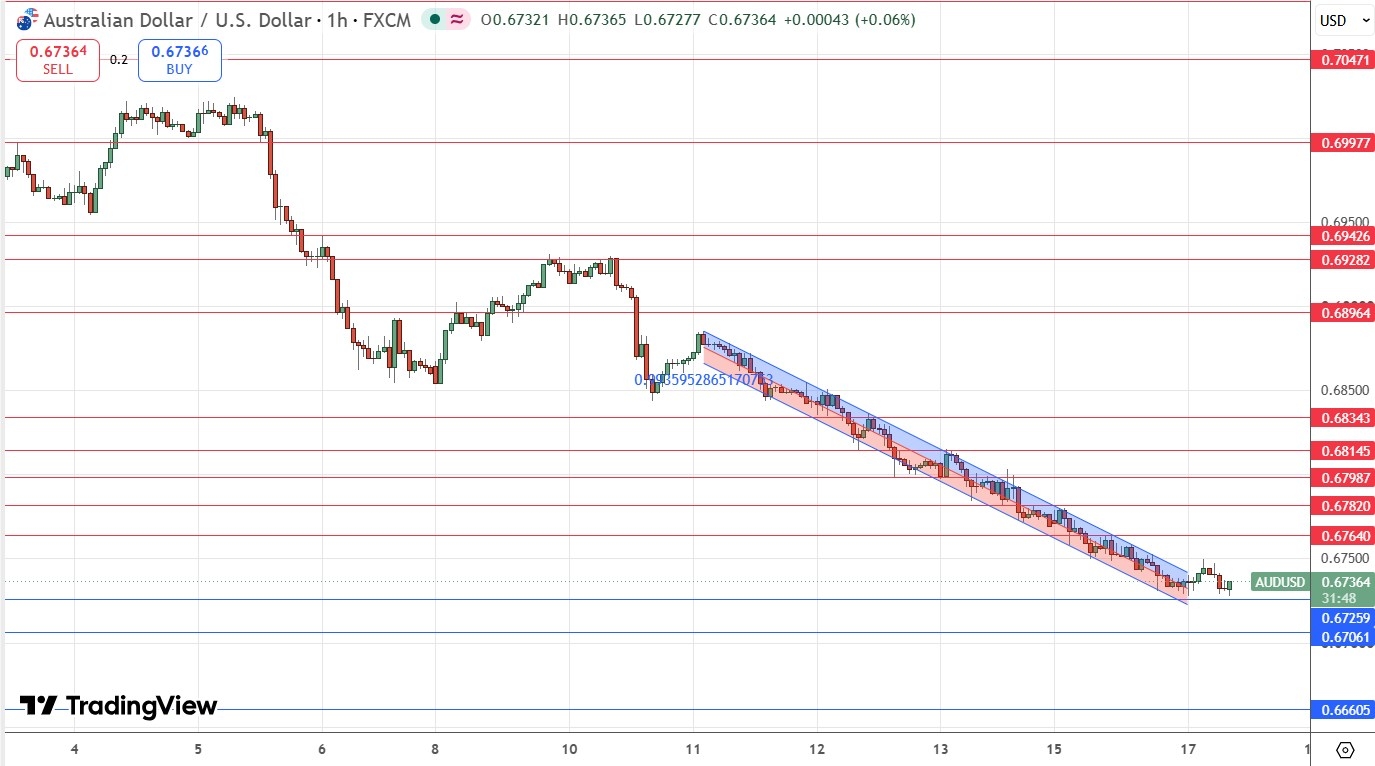
AUD/USD H1 Price Chart – Descent to 11-Month Low
My Take on AUD/USD Today
It might be possible for scalpers to get a few long pips from the bounce at support which seems to be starting to happen here, but everyone else should only be thinking about a short trade setup. I would hope that the Retail Sales data will push the price higher to 0.6764 or one of the slightly higher resistance levels where the price will reverse and turn bearish again, giving an opportunity for a short trade entry targeting at least 0.6725, if the reward to risk potential is suitable.
Support & Resistance Levels
My previous AUD/USD signal on 5th November was not triggered.
Risk 0.25%.
Trades must be taken before 5pm Tokyo time Wednesday.
Short Trade Ideas
Go short following a bearish price action reversal on the H1 time frame immediately upon the next touch of 0.6764, 0.6782, or 0.6799.
Place the stop loss 1 pip above the local swing high.
Adjust the stop loss to break even once the trade is 20 pips in profit.
Take off 50% of the position as profit when the price reaches 20 pips in profit and leave the remainder of the position to ride.
Long Trade Ideas
Long entry following a bullish price action reversal on the 1H1 time frame H1H1H1 time frame immediately upon the next touch of 0.6725, 0.6706, or 0.6661.
Put the stop loss 1 pip below the local swing low.
Move the stop loss to break even once the trade is 20 pips in profit.
Remove 50% of the position as profit when the price reaches 20 pips in profit and leave the remainder of the position to ride.
The best method to identify a classic “price action reversal” is for an hourly candle to close, such as a pin bar, a doji, an outside or even just an engulfing candle with a higher close. You can exploit these levels or zones by watching the price action that occurs at the given levels.
Concerning the US Dollar, there will be a release of Retail Sales data at 1:30pm London time.
Ready to trade our free Forex signals? Here is our list of the top Forex brokers worth reviewing.