


Top Regulated Brokers
Bitcoin has rebounded from $62K, but $2.35 billion in two-week ETF outflows and weak momentum leave its recovery uncertain. Watch $62K and $68K.
King Crypto’s latest decline has put the market’s recovery prospects to question, with investors weighing persistent fund withdrawals against a deteriorating technical structure. The sell-off also raises a broader question: whether the recent weakness is a temporary correction driven by forced selling or the beginning of a deeper bearish phase.
Although Bitcoin has rebounded from its weekend low, the recovery has yet to reverse the signals coming from institutional flows and longer-term moving averages. The latest US producer-price data offered some relief on the inflation front, but it has not been enough to restore confidence. Traders are now watching whether buyers can defend nearby support or whether another wave of selling will expose lower price levels.
Why $2.35 Billion in ETF Outflows Matters for Bitcoin’s Rebound
Bitcoin briefly fell towards $61,900 over the weekend, reaching its lowest level in four months before recovering to the current levels above $64,000. The rebound has not yet changed the broader market structure, however, as BTC remains well below several important moving averages. The latest decline also followed a sustained period of withdrawals from US spot Bitcoin exchange-traded funds (ETFs), suggesting that selling pressure is not limited to leveraged derivatives traders.
Data from SoSo Value show that US spot Bitcoin ETFs recorded approximately $1.07 billion in net outflows between November 9 and November 13. This followed $1.28 billion in withdrawals during the previous week, bringing the two-week total to around $2.35 billion. The latest week marked the second consecutive period with more than $1 billion in redemptions.
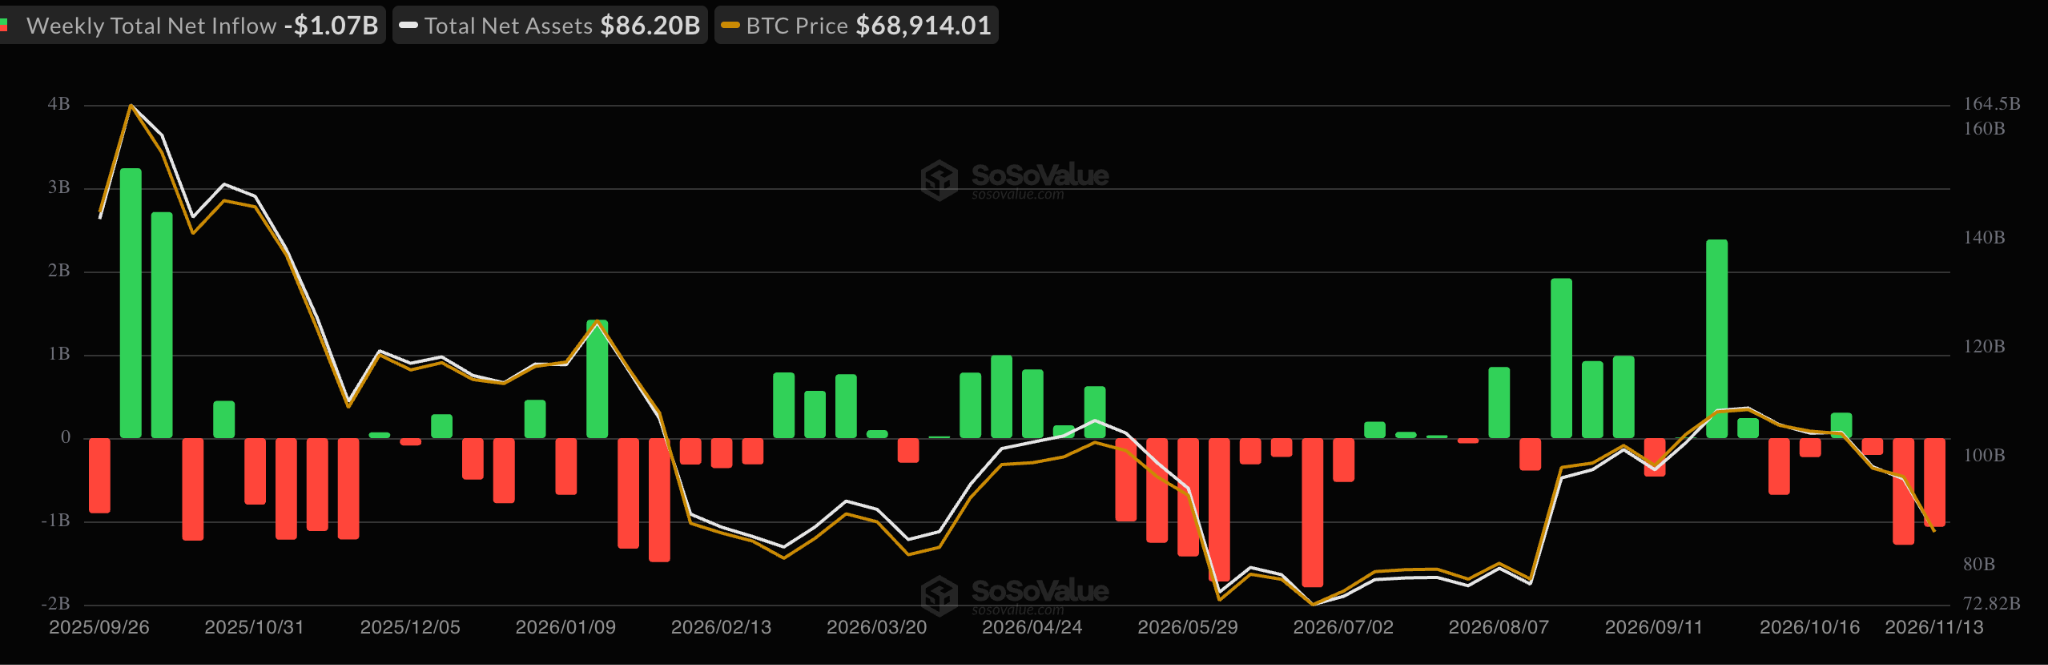
Spot Bitcoin ETF flows chart. Source: SoSoValue
BlackRock’s iShares Bitcoin Trust (IBIT) accounted for a substantial share of the withdrawals. The fund recorded its 11th consecutive trading session of outflows on November 13, with approximately $2.35 billion leaving the product during that streak. Its withdrawals represent roughly 90% of the broader spot Bitcoin ETF market’s November outflows to date.
ETF redemptions reflect reduced institutional demand for direct Bitcoin exposure, rather than simply forced liquidations in futures markets. When funds experience net outflows, investors generally redeem shares, reducing the associated Bitcoin exposure. Persistent withdrawals, therefore, remove a visible source of institutional demand, making it harder for spot buyers to absorb selling pressure.
The October US Producer Price Index (PPI) offered a more mixed macroeconomic signal. The US Bureau of Labor Statistics (BLS) reported that final-demand producer prices rose 0.3% month over month, slowing from September’s 1.4% increase. However, the index was still up 6.5% over the 12 months to October. The measure excluding food, energy and trade services increased 0.5% month over month and 4.9% year over year.
“Leading the October advance in final demand prices, the index for final demand goods increased 0.5 percent. Prices for final demand services moved up 0.2 percent,” the US Bureau of Labor Statistics (BLS) reported Friday.
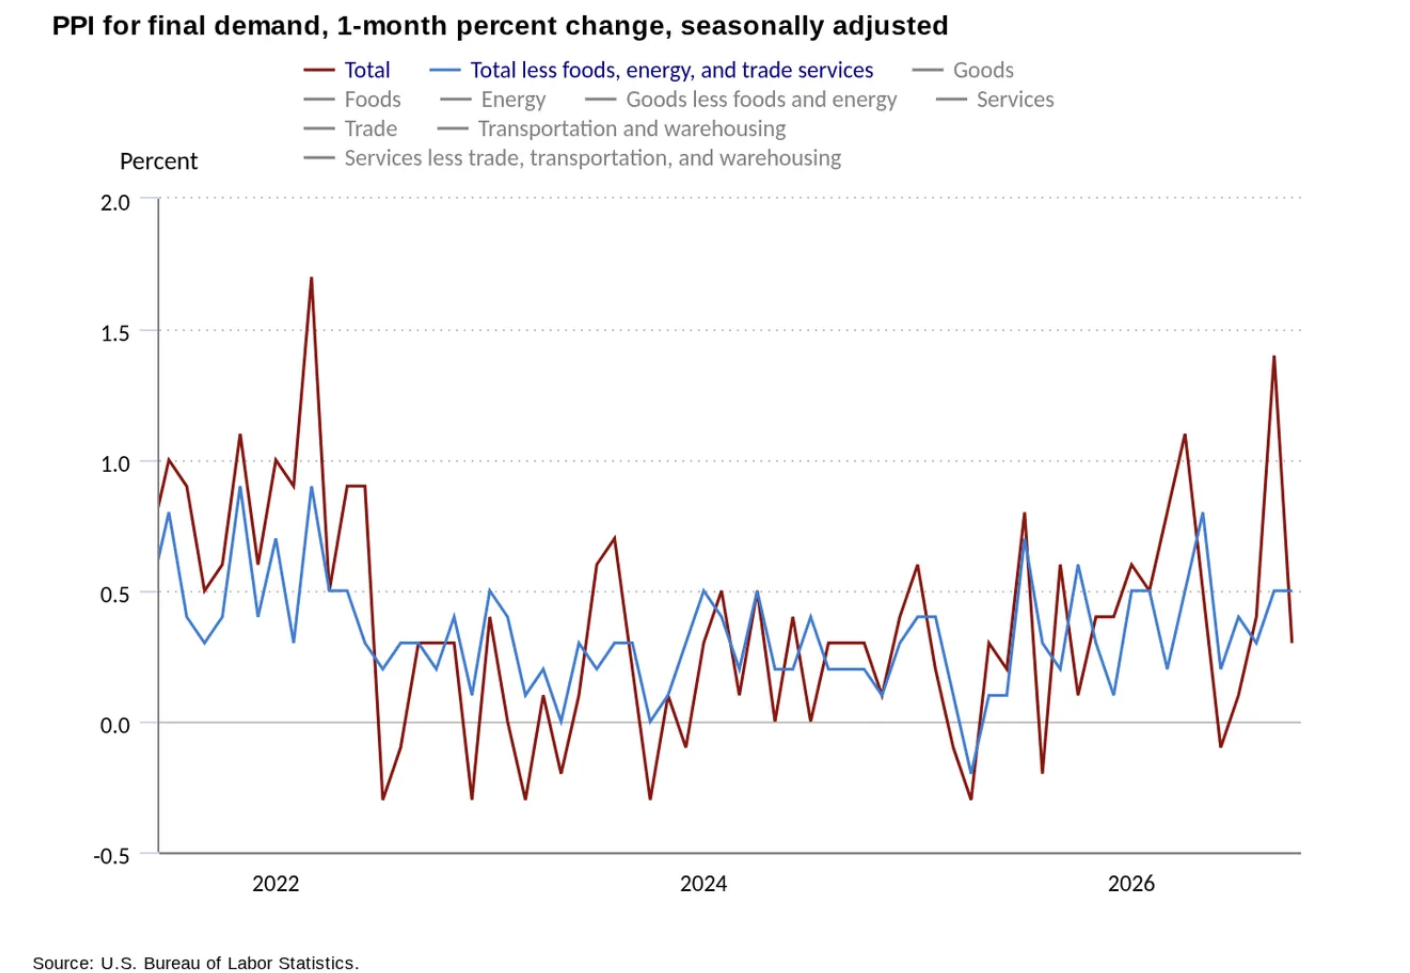
US PPI one-month percentage change. Source: BLS
The slower monthly headline increase may ease some concerns about accelerating wholesale prices. Yet the underlying measures show that cost pressures remain elevated. PPI does not measure consumer inflation directly, but persistent increases in producer costs can eventually feed through to prices paid by households.
For Bitcoin, the implications depend on how investors interpret the data and whether it changes expectations for Federal Reserve policy. Therefore, the broader market remains vulnerable to further selling if investors continue reducing exposure to risk-sensitive assets.
Bitcoin Remains Below Key Weekly Moving Averages
Bitcoin’s weekly chart shows how far the market has weakened. At the time of writing, BTC traded near $64,551, below its 50-week simple moving average (SMA) at approximately $74,500 and its 200-week SMA near $68,000. The 100-week SMA stood considerably higher, around $88,500.
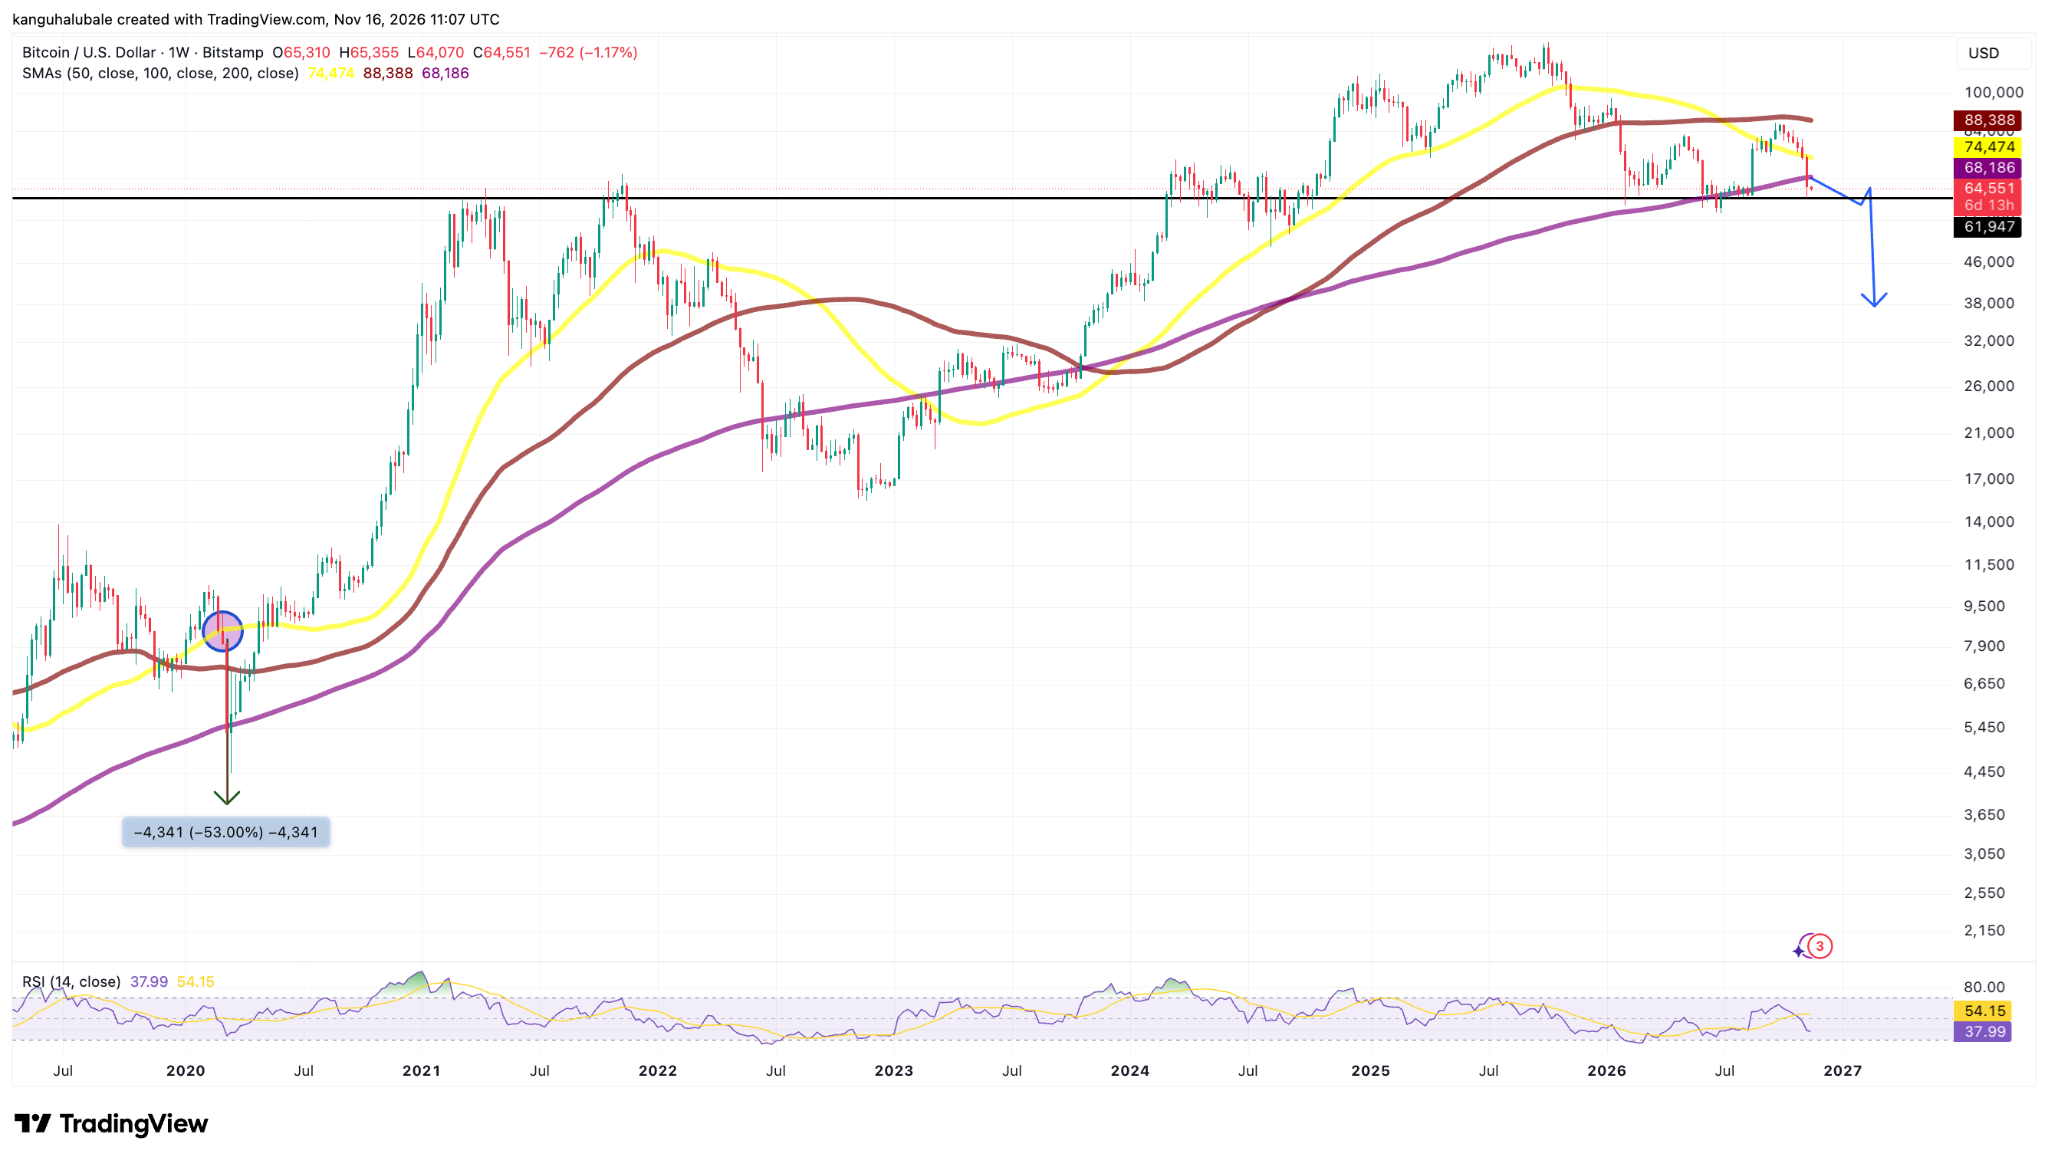
BTC/USD weekly chart. Source: TradingView
The loss of both the 50-week and 200-week averages is significant because these indicators have often acted as important reference points for longer-term market structure. Bitcoin had reclaimed the 50-week SMA in September, but subsequent selling pushed the price back below it. Two consecutive weekly closes beneath this average, as indicated in the chart above, suggest that buyers are unable to sustain higher levels.
The previous episode in March 2020 offers a historical comparison. Bitcoin’s loss of the 50-week SMA around that period preceded a decline of approximately 53%, as illustrated in the chart.
Bitcoin’s price action offers a similar moving-average signal, which may lead to further declines.
The 200-week SMA around $68,000 is another important level, with Bitcoin already trading below it. A recovery above this average would be an early step towards repairing the longer-term structure. Until then, the indicator may act as overhead resistance rather than support.
The four-hour chart presents a more immediate bearish setup. Bitcoin has been consolidating around $64,500 after a sharp decline from the $74,000 area. The price action has formed a bear pennant, with lower highs developing inside two converging lines.
The chart places the pattern’s projected downside target near $54,780, representing a potential decline of roughly 15% from the current levels.
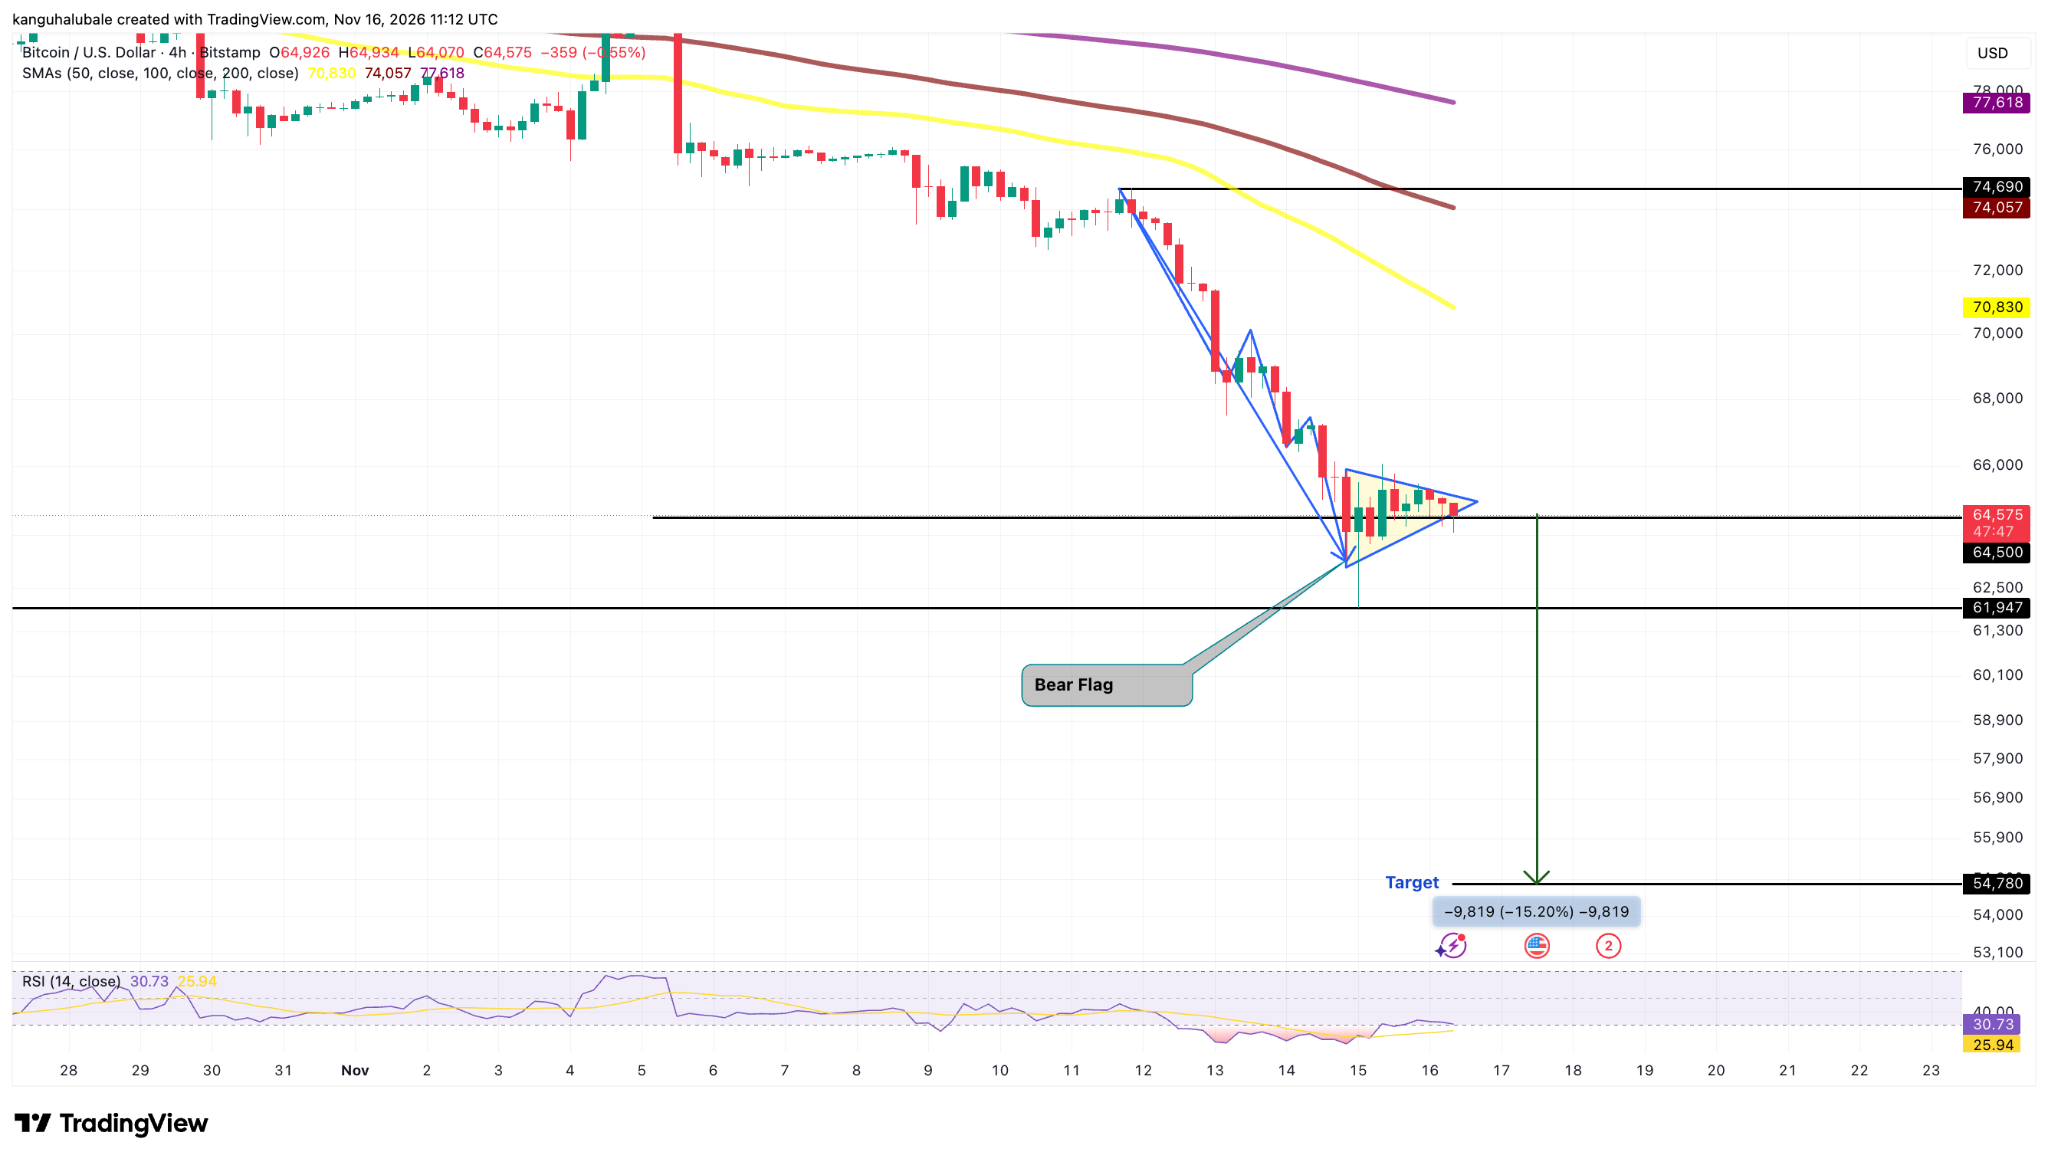
BTC/USD four-hour chart. Source: TradingView
A confirmed break below the flag’s lower boundary and the horizontal support around $64,500 would strengthen the bearish setup. A move back above the pattern’s upper trendline, by contrast, would weaken the immediate downside signal.
Momentum indicators also reflect the pressure on buyers. The four-hour Relative Strength Index (RSI) stood near 30.73, close to oversold territory. The weekly RSI sits around 37.99, below its signal average. These readings indicate weak momentum, although an oversold reading alone does not establish that a durable bottom is in place.
$62K Support and $68K Resistance Frame Bitcoin’s Next Test
The immediate test for Bitcoin is whether buyers can prevent another sustained move below the weekend low near $61,900. A break beneath that area would expose the market to further downside and could reinforce the bear-flag setup on the four-hour chart. If selling accelerates, the projected target of around $54,780 becomes a level traders may monitor, rather than a guaranteed destination.
On the upside, the first challenge is a sustained recovery above $68,000, where the 200-week SMA currently sits. Reclaiming that average would help reduce the pressure on the longer-term structure. Bitcoin would then need to overcome the 50-week SMA near $74,500 to signal a more meaningful recovery.
What Would Make Bitcoin’s Recovery More Convincing?
Bitcoin’s fall towards $62,000 reflects a combination of persistent ETF redemptions, weak momentum and a breakdown below important long-term moving averages. The $2.35 billion in two-week ETF outflows suggests that institutional demand has weakened, while the latest PPI figures offer only mixed reassurance about inflation.
The technical picture remains vulnerable while BTC trades below its 200-week and 50-week SMAs. A break below the latest low at $61,900 could reinforce the four-hour bear flag, whose measured target sits below $55,000. Conversely, a recovery above the 200-week average, followed by improving ETF flows, would provide an early indication that buyers are regaining control.
For now, the key question is whether the rebound from the weekend low attracts sustained spot demand or proves to be a temporary pause in the decline. The next moves in ETF flows and Bitcoin’s weekly closes should help clarify that distinction.
Ready to trade our analysis of Bitcoin? Here’s our list of the best MT4 crypto brokers worth checking out.