


King Crypto’s latest sell-off has exposed how quickly leveraged optimism can turn into forced selling. Bitcoin fell to approximately $73,500 over the weekend, its lowest level since August, as more than $1 billion in crypto positions were liquidated over the last 24 hours. Long positions accounted for most of the wipeout, showing that traders were heavily positioned for a recovery when the market moved lower. The decline followed weakness in US technology and AI stocks, alongside substantial withdrawals from spot Bitcoin exchange-traded funds (ETFs).
Top Regulated Brokers
The pressure has now extended beyond derivatives markets. US spot Bitcoin ETFs recorded approximately $1.28 billion in net outflows during the week ended November 6, their largest weekly withdrawals since June. Bitcoin is also trading below its 50-day and 100-day moving averages, leaving the 200-day moving average near $73,150 as an important support level. Whether buyers defend this area could determine if the latest decline remains a sharp correction or develops into a deeper trend reversal.
Why Bitcoin Fell: $1B in Liquidations and Heavy ETF Outflows
The liquidation wave was driven primarily by forced exits from leveraged long positions. Data from CoinGlass shows more than $1 billion in crypto liquidations over 24 hours, including approximately $1.03 billion in longs. Bitcoin accounted for about $302 million, while Ether recorded roughly $495 million. The figures indicate that traders betting on higher prices bore most of the damage as prices fell through key short-term support levels.
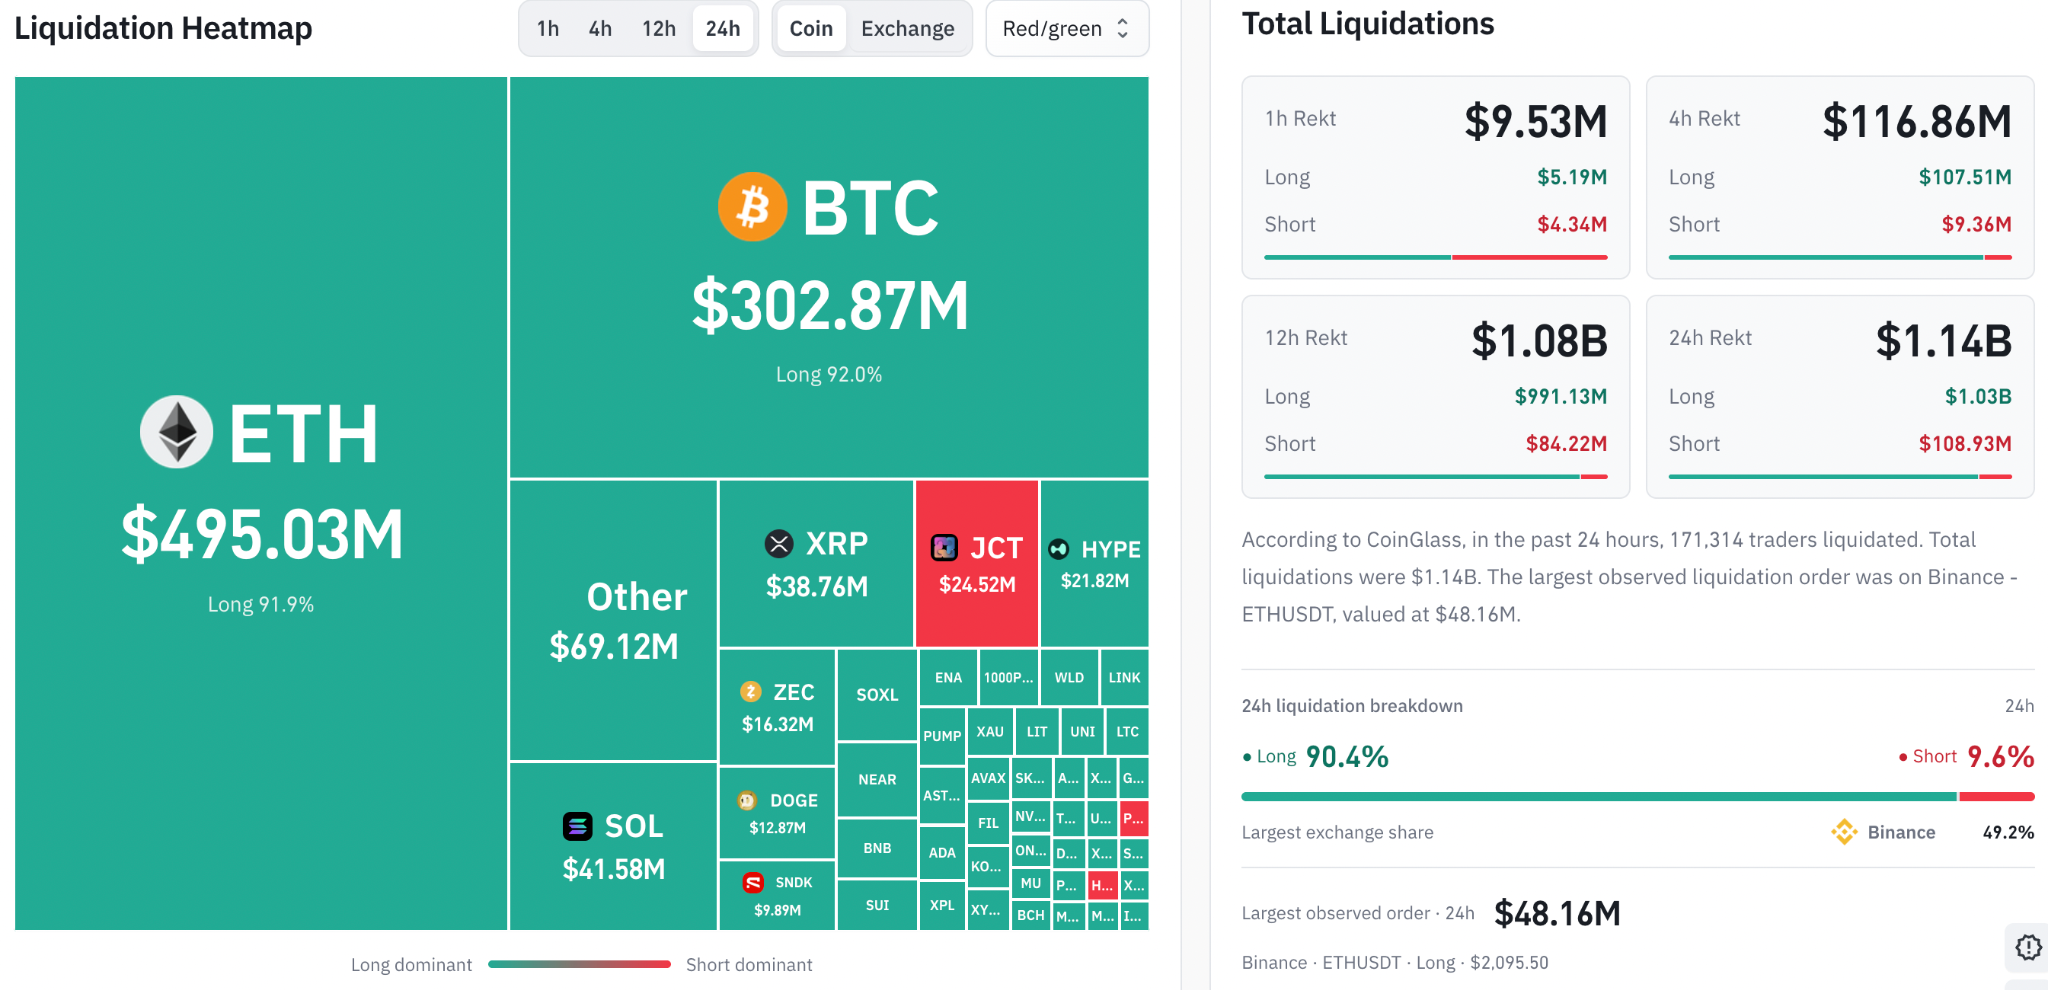
Total crypto liquidations. Source: CoinGlass
Bitcoin dropped to a 10-week low of around $73,500 on Sunday before recovering above $75,500, according to data from TradingView. The move followed a sharp deterioration in risk appetite, with markets reacting to weakness in technology and AI-related stocks, as well as reports that US-Iran negotiations had stalled. Because traditional markets were closed over the weekend, crypto initially absorbed the reaction to those headlines.
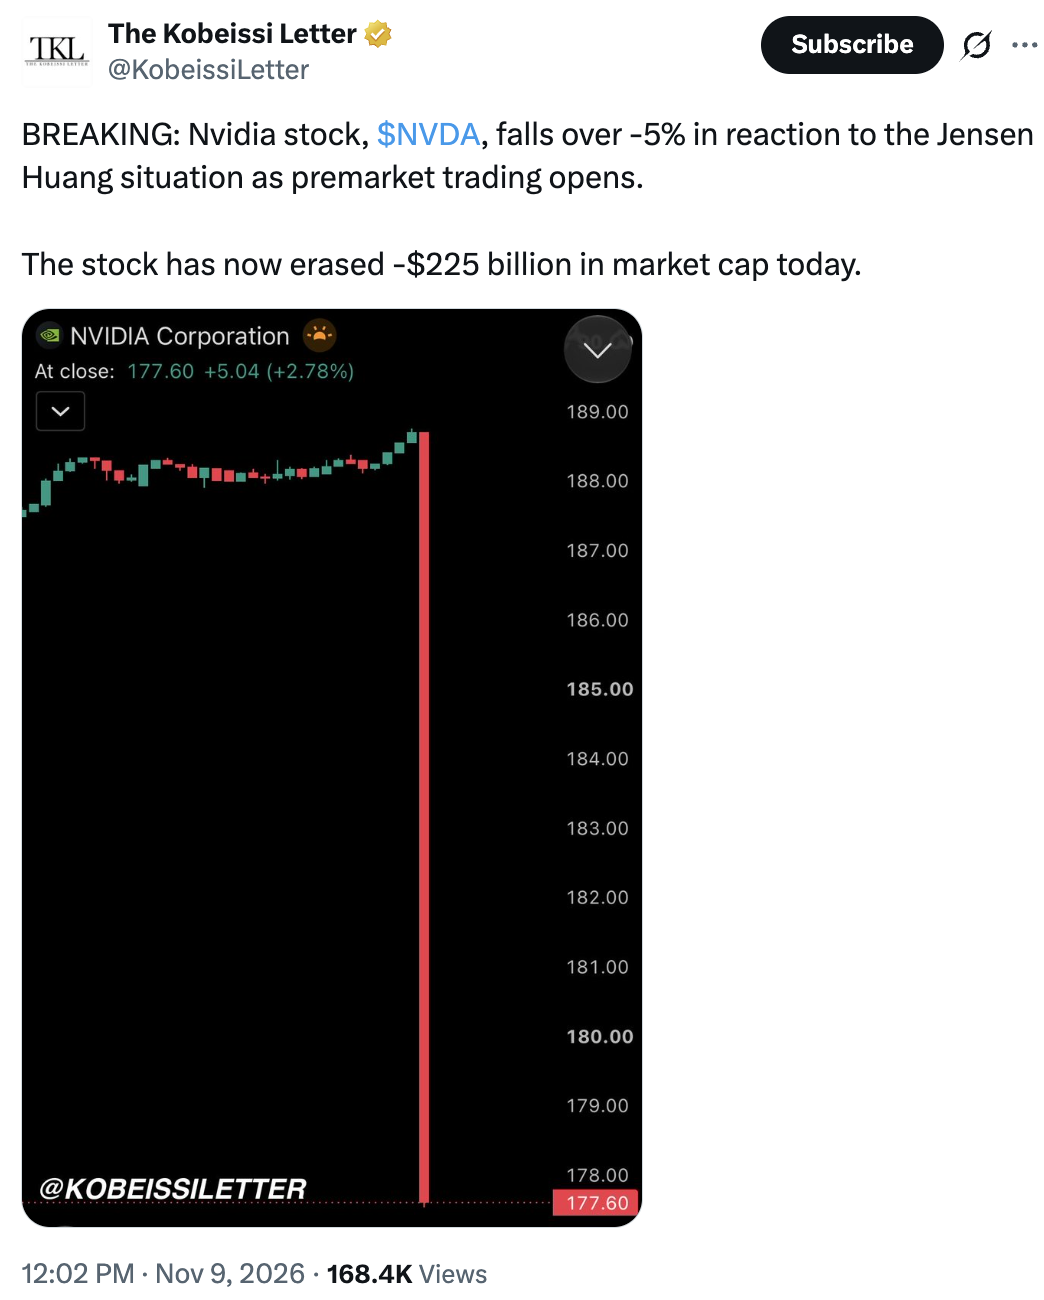
Nvidia stock falls 5% within hours. Source: The Kobeissi Letter/X
This context matters because the sell-off was not simply a crypto-specific event. Bitcoin has increasingly traded alongside broader risk assets, particularly when investors reassess valuations in technology and other growth sectors. When confidence in those markets weakens, leveraged crypto positions can become vulnerable to rapid deleveraging.
However, forced selling was only part of the pressure. Spot Bitcoin ETFs also recorded substantial withdrawals, suggesting that demand from traditional investment channels weakened at the same time.
According to data from SoSoValue, US spot Bitcoin ETFs recorded approximately $1.28 billion in net outflows during the week ending Nov. 6. This was their largest weekly outflow since late June and pushed the funds’ 2026 net flows into negative territory, with about $914 million in net withdrawals for the year.
BlackRock’s iShares Bitcoin Trust (IBIT) accounted for a significant share of the selling. The fund recorded approximately $403 million in outflows on Nov. 6 alone, representing about 88% of that day's aggregate withdrawals.
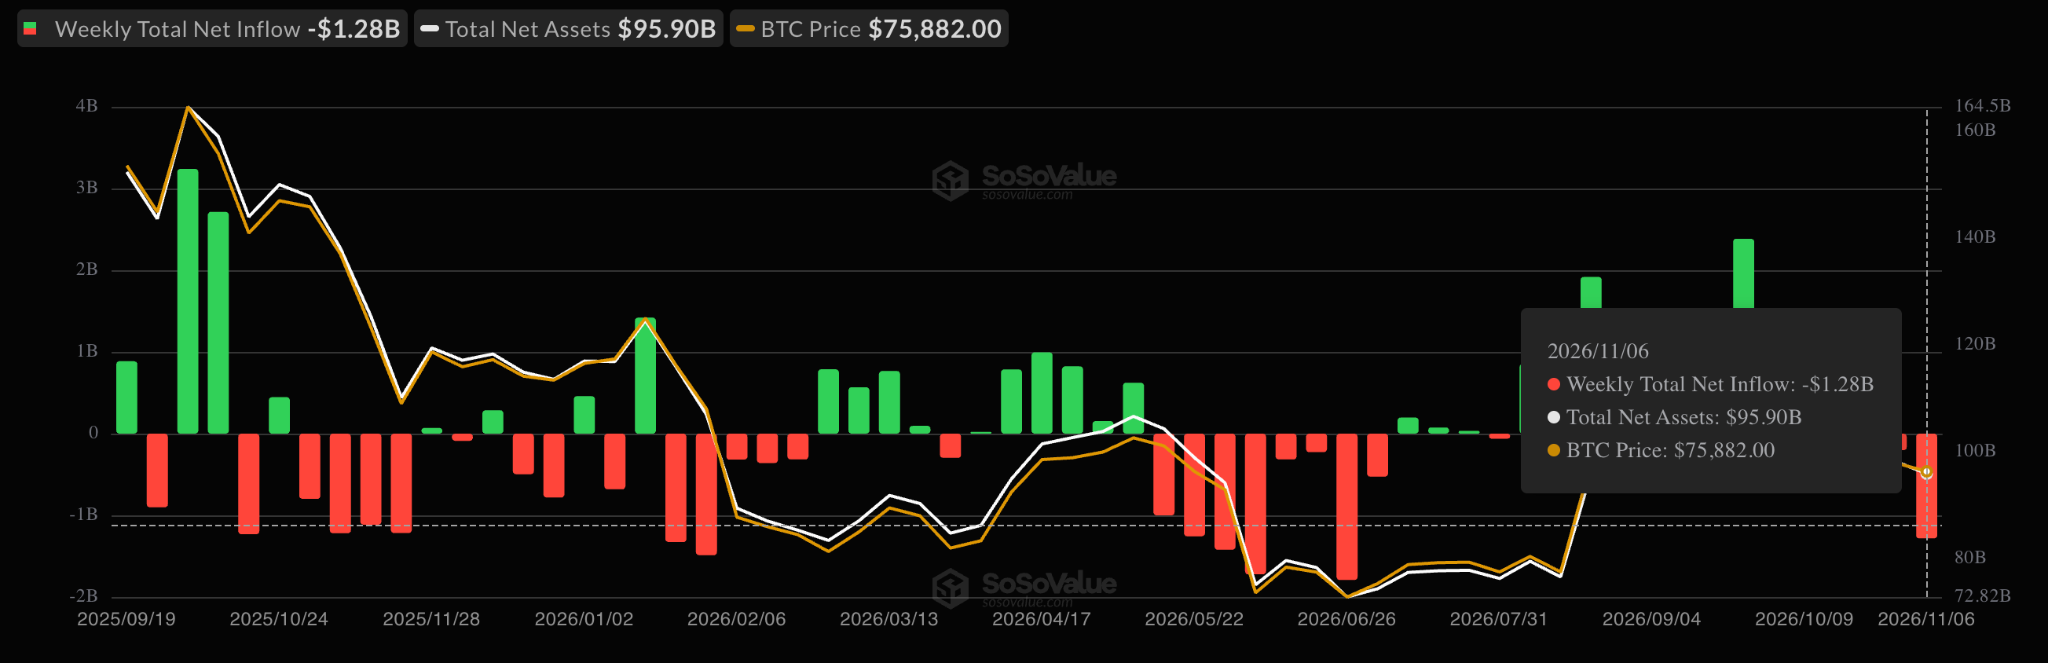
Spot Bitcoin ETF flows chart. Source: SoSoValue
Heavy spot BTC ETF outflows indicate that selling pressure is not limited to futures traders facing margin calls. Investors withdrawing capital from spot funds suggests weakness in demand for Bitcoin exposure, adding to the selling pressure.
The combination of derivatives liquidations and ETF withdrawals, therefore, presents a more concerning picture than either development in isolation. Leverage has been reduced, but not necessarily eliminated. If technology stocks remain under pressure and ETF outflows persist, Bitcoin could face further volatility as traders reassess risk and buyers wait for clearer signs of demand.
Bitcoin Price Outlook: Can $73K Support Hold?
Bitcoin’s daily chart shows the price trading below two important moving averages, leaving the 200-day simple moving average (SMA) as the next major technical level to defend.
The chart below shows the BTC/USD pair trading at $74,134, below the 50-day SMA at approximately $81,604 and the 100-day SMA near $77,405. Both averages now sit above the spot price and could act as resistance during any recovery. The 200-day SMA, by contrast, is around $73,150, close to the latest price and within the support area highlighted on the chart.
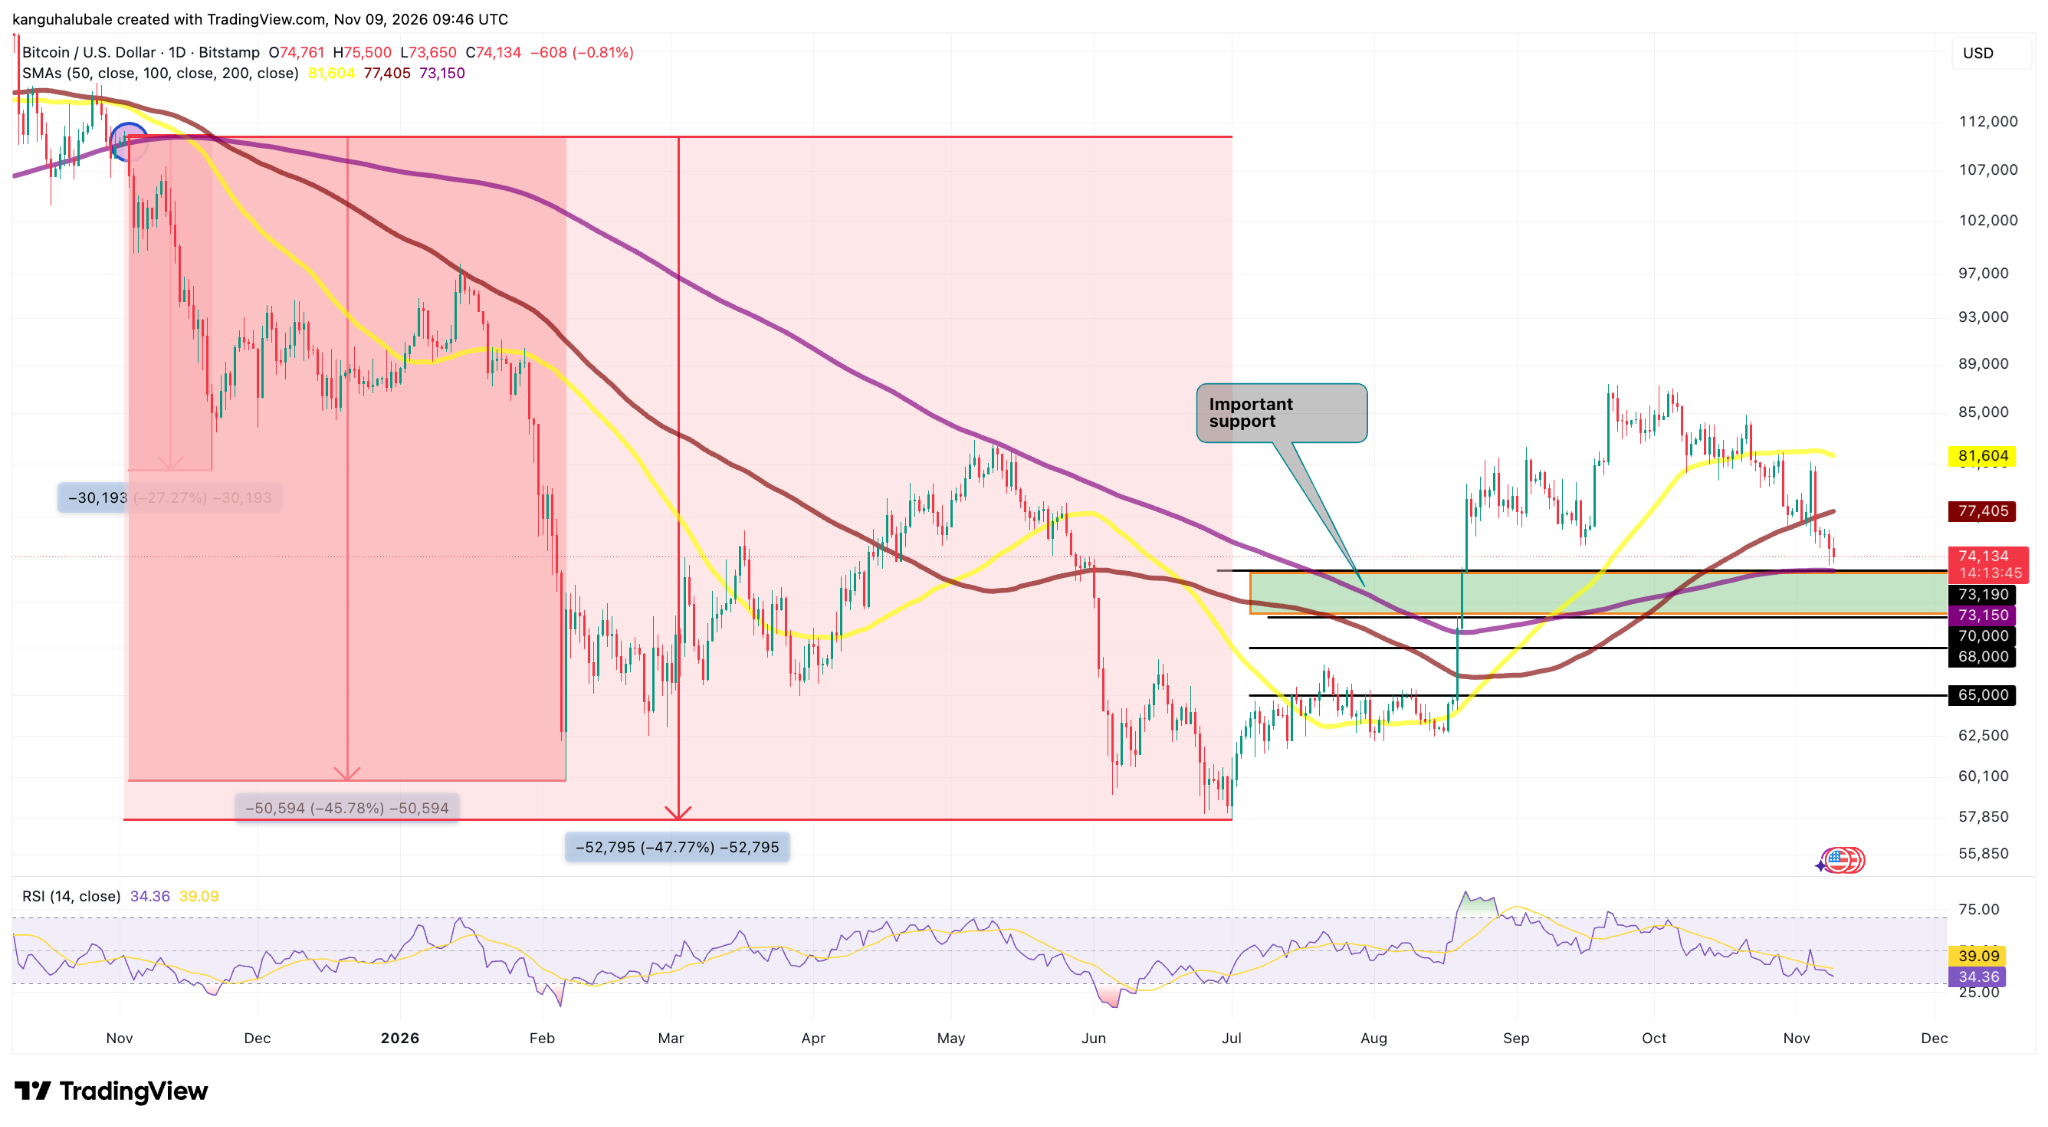
BTC/USD daily chart. Source: TradingView
This makes the 200-day average particularly important. It is widely monitored as a gauge of Bitcoin’s longer-term trend, and a sustained move below it could signal that the market is losing its broader bullish structure. The chart also illustrates previous periods when Bitcoin lost this average and subsequently experienced substantial declines. Those historical drawdowns ranged from approximately 27% to nearly 48%.
Past performance does not mean another decline of similar magnitude is inevitable. Market conditions, liquidity and investor positioning differ across cycles. Nevertheless, the historical examples underline why a decisive break below the 200-day SMA could change how traders assess Bitcoin’s outlook.
On-chain data adds another layer to the support picture. CryptoQuant analyst Crypto Sunmoon has highlighted the short-term holder cost basis as an important area where buying pressure could emerge. Short-term holders generally represent investors who acquired Bitcoin relatively recently and can be more sensitive to price fluctuations than long-term holders.
The chart below identifies a support area around the recent buyers’ cost basis near $75,800. Bitcoin’s move below this level leaves some recent buyers holding unrealized losses, potentially increasing selling pressure if the price fails to recover.
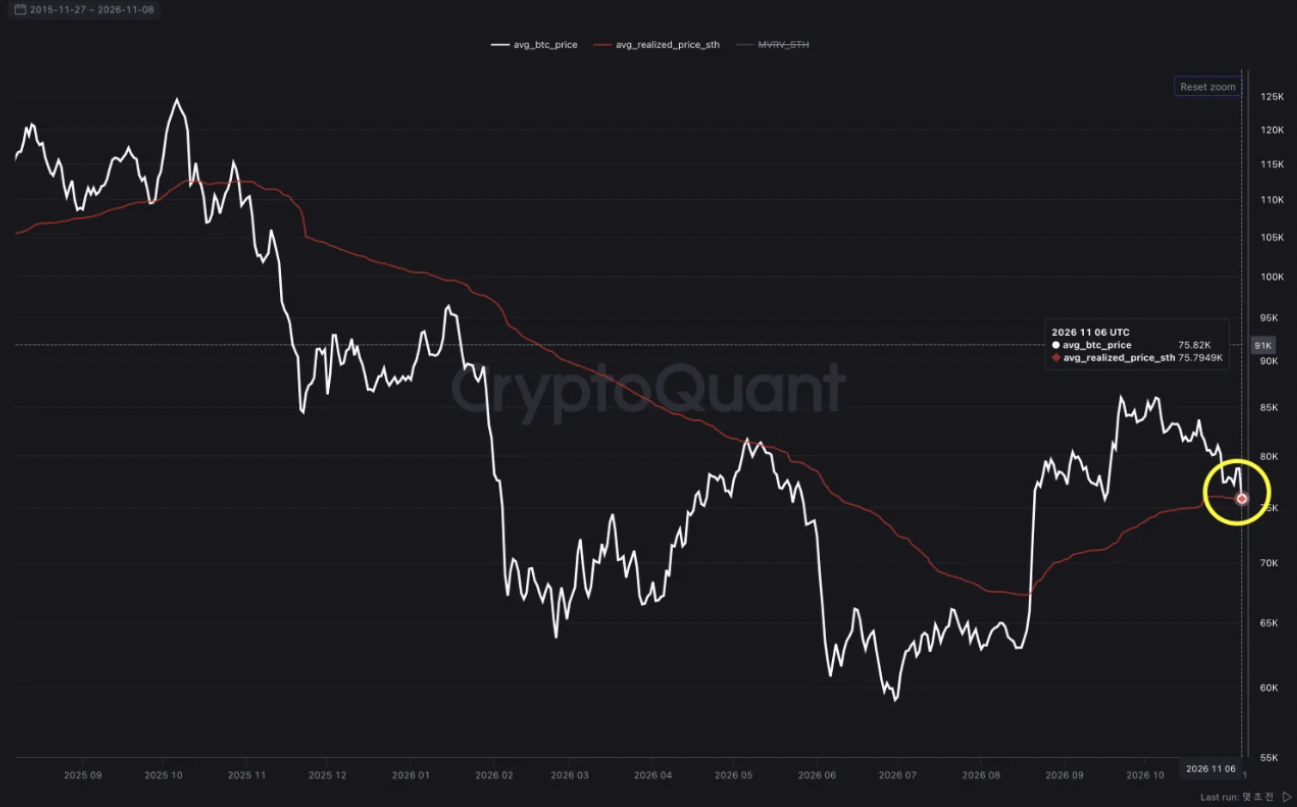
BTC/USD vs. short-term holder cost basis. Source: CryptoQuant
The $70,000 psychological level is another important marker below the current market. If Bitcoin loses the 200-day SMA and then fails to hold $70,000, the technical outlook will deteriorate further. The TradingView chart identifies subsequent support areas around $68,000 and $65,000 as possible levels which the price could revisit.
The daily Relative Strength Index (RSI) on the daily chart was approximately 34.36, below the neutral 50 level and approaching oversold territory. This suggests bearish momentum remains dominant, although an RSI reading below 30 would provide a stronger indication of an oversold market. A low RSI alone does not confirm that a bottom is in place.
For bulls, the first sign of recovery would be reclaiming the 100-day SMA near $77,405. A move above that level would improve the short-term structure, but the 50-day SMA around $81,604 remains a more significant resistance hurdle. Until Bitcoin recovers these averages, rallies could encounter selling from traders looking to exit positions closer to their entry prices.
Bitcoin’s Next Move: Recovery Above $77K or a $70K Test?
Bitcoin’s decline to approximately $73,500 has exposed two sources of market weakness: heavy liquidations in leveraged derivatives and sustained withdrawals from spot ETFs. More than $1 billion in crypto positions were liquidated over 24 hours, with longs accounting for most of the total. Meanwhile, the $1.28 billion weekly ETF outflow indicates that institutional demand has weakened alongside speculative positioning.
The immediate technical test is the 200-day SMA near $73,150. Holding this level and recovering above the short-term holder cost basis would suggest that buyers are absorbing selling pressure. A sustained move back above $77,405, followed by the 50-day SMA near $81,604, would provide stronger evidence that the recovery is gaining traction.
Conversely, a decisive break below the 200-day average would put $70,000 in focus. Failure to defend that psychological level could expose Bitcoin to the next support areas around $68,000 and $65,000.
My view is cautiously bearish until Bitcoin reclaims its key moving averages, particularly the 50-week SMA. The liquidation flush may have removed some excess leverage, but ETF redemptions suggest that spot demand is also weakening. A durable trend reversal would require more than a short-lived rebound: buyers need to defend the 200-day SMA, reclaim the recent buyers’ cost basis and attract renewed ETF inflows. Without those signals, the risk of another leg lower remains elevated.
Ready to trade our analysis of Bitcoin? Here’s our list of the best MT4 crypto brokers worth checking out.