


Bearish view
Sell the BTC/USD pair and set a take-profit at 58,000.
Add a stop-loss at 69,000.
Timeline: 1-2 days.
Bullish view
Buy the BTC/USD pair and set a take-profit at 69,000.
Add a stop-loss at 58,000.
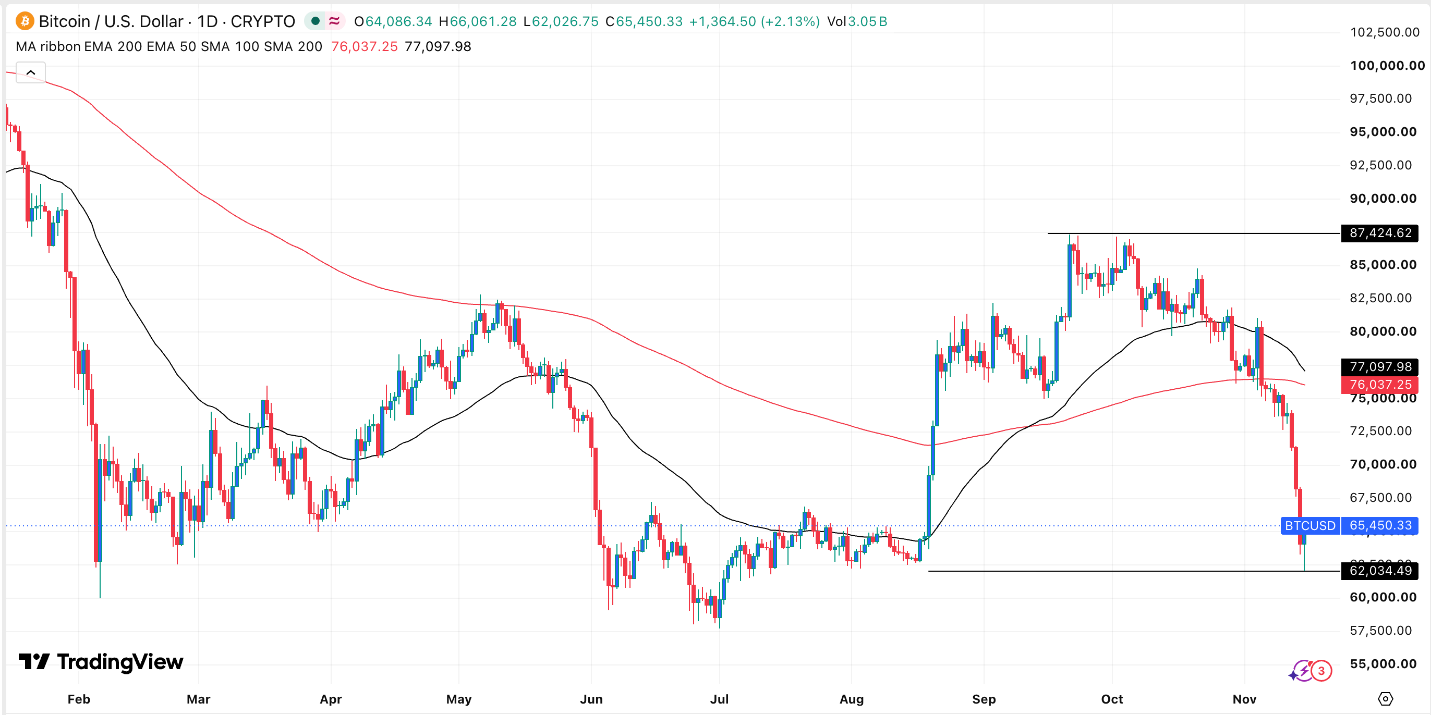
Bitcoin price plunged to its lowest level since August as demand for the coin continued falling amid rising risks. BTC/USD pair was trading at 65,290, down by over 25% from its highest point in September. It is about to form a death cross pattern, which may signal more downside in the near term.
Top Regulated Brokers
Bitcoin Price Falls as Demand Wanes
BTC/USD pair continued falling as demand in the spot, futures, and ETF market waned. CoinMarketCap data shows that the 24-hour volume for Bitcoin was about $30 billion, much lower than where it was a few months ago.
Further, the futures open interest have continued falling in the past few weeks. The open interest stood at over $42 billion, much lower than the year-to-date high of $62 billion. Falling open interest is a sign that demand among speculators has continued the downward trend.
The same is happening in the ETF market, where outflows have soared. These funds had over $185 million in outflows on Friday, bringing the weekly losses to over $2.3 billion. They lost $515 million in October.
The trend has accelerated because of the recent events in the United States. Democrats won the midterm elections by a large margin, meaning that the industry will come under scrutiny. Also, the US has published strong macro numbers of late, raising the possibility of the Federal Reserve hiking interest rates.
A report showed that the economy grew by 3.4% last quarter, higher than what analysts were expecting. Another report showed that the economy created 165k jobs last month as the unemployment rate fell to 4.1%. A separate report showed that inflation remained substantially higher than expected.
BTC/USD Technical Analysis
The daily chart shows that the BTC/USD pair has slumped in the past few months, moving from a high of 87,425 to a low of 62,000 during the weekend. It is now about to form a death cross pattern as the spread between the 50-day and 200-day moving averages narrow. In most cases, this pattern often leads to more downside.
The pair has remained below the Supertrend indicator. It has also remained below the Ichimoku cloud indicator. Therefore, the pair will likely continue falling, potentially to the next key support level of 58,000. A move above the resistance level of 70,000 will point to more gains.
Ready to trade our free Forex signals? Here are the best MT4 crypto brokers to choose from.