


Bearish view
Sell the BTC/USD pair and set a take-profit at 60,000.
Add a stop-loss at 64,000.
Timeline: 1-2 days.
Bullish view
Buy the BTC/USD pair and set a take-profit at 64,000.
Add a stop-loss at 60,000.
Top Regulated Brokers
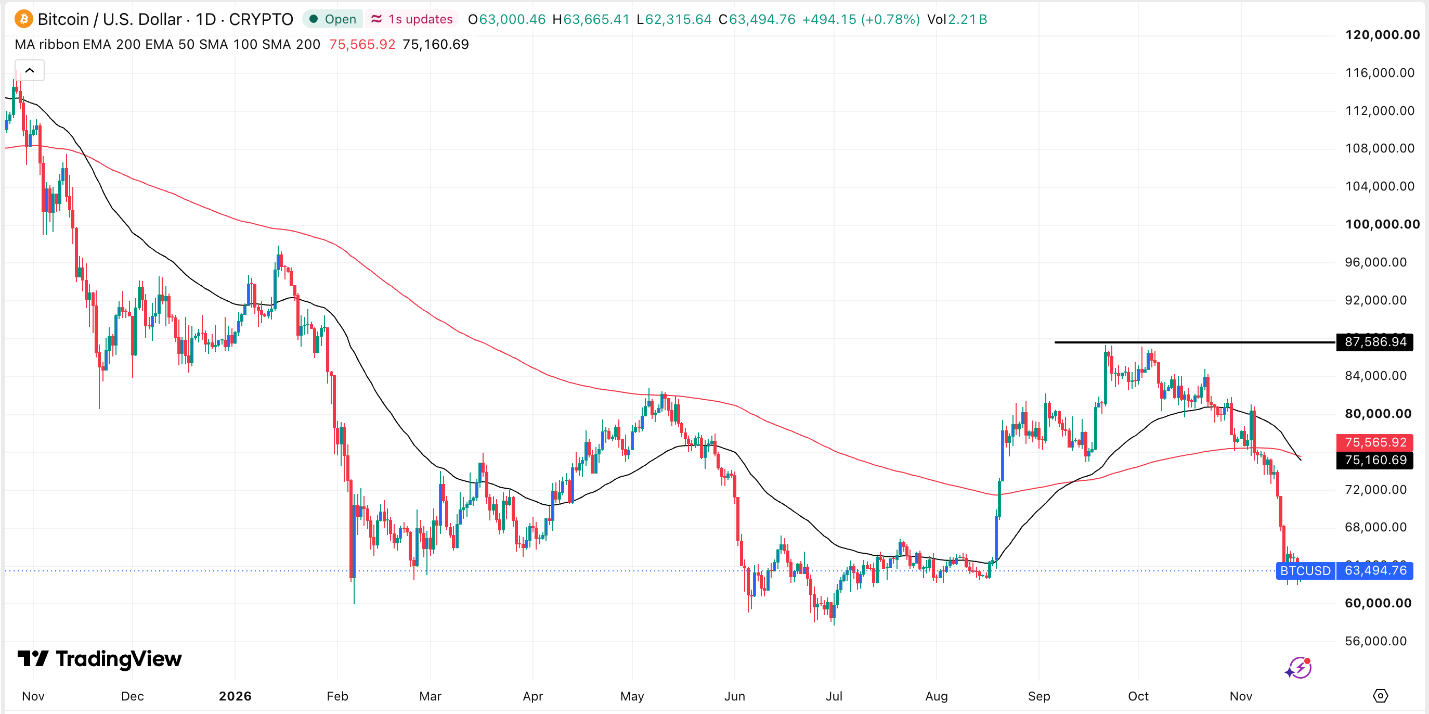
Bitcoin extended its slide and formed a death cross as selling pressure intensified. The BTC/USD pair fell to 62,570, down sharply from its October high of 87,586. This decline could continue over the coming days or weeks as demand remains muted.
Bitcoin Pressured as Demand Wanes
The BTC/USD pair has continued its strong sell-off as demand for the coin waned. This retreat happened as spot Bitcoin ETF outflows continued. These funds have now shed over $2.5 billion this month, a big increase from last month’s $515 million. They now have a cumulative inflow of $54 billion and net assets of $79.65 billion.
Bitcoin’s 24-hour trading volume has continued to fall, a sign that demand is fading. Futures open interest has also declined this month, which suggests leveraged traders are scaling back their positions.
The ongoing retreat has also coincided with that of other assets. For example, gold has continued falling, reaching a low of $3,726, much lower than the year-to-date high of $5,600. The stock market has also continued to fall, with the Dow Jones and Nasdaq 100 indices being much lower than their year-to-date highs.
Bitcoin has slumped amid the ongoing US dollar rally. The dollar index (DXY) has jumped to 103.50, its highest level since March last year. BTC/USD pair normally drops when the greenback is rising because the two have an inverse relationship.
Bitcoin has also dropped because of the rising fear in the market, with the Crypto Fear and Greed Index falling to the extreme-fear zone of 12.
BTC/USD Technical Analysis
The daily chart shows that the BTC/USD pair has been in a strong sell-off in the past two months. A closer look at the chart shows that it has formed a death cross pattern as the 50-day and 200-day moving averages cross each other. This pattern normally leads to more downside.
The pair has moved below the Ichimoku cloud, which is a bearish sign. On the other hand, the Relative Strength Index (RSI) has moved to the extreme oversold level of 21. Therefore, there is a likelihood that it will keep falling, potentially below the support of 60,000. A move above the resistance of 65,000 will invalidate the bearish outlook.
Ready to trade our free Forex signals? Here are the best MT4 crypto brokers to choose from.