


Fundamental Backdrop and Market Sentiment
I wrote on 8th November that the best trades for the week would be:
Short of the EUR/USD currency pair below $1.1300. This pair fell over the week by 1.06%.
A summary of last week’s most important data in the market:
US CPI (inflation) – both core CPI and CPI came in a tick higher than expected, causing a reassessment of the Fed's rate hike path.
US PPI – this was a tick lower than expected, which slightly mitigated the higher CPI.
UK GDP – no gain was expected, but the month-on-month data came in at 0.2%, although this had little effect on the market.
Financial markets experienced another volatile week as US inflation data reinforced expectations of further Federal Reserve tightening. October’s CPI rose 0.4% month-on-month and core CPI increased 0.3%, both exceeding forecasts by 0.1 percentage point. Friday’s PPI offered only partial relief: the monthly increase of 0.3% was below expectations, but annual producer-price inflation accelerated to 6.5%, its highest in nearly four years. Higher Treasury yields and hawkish Fed commentary helped lift the US Dollar Index to its strongest level since April 2025, a roughly 19-month high, as traders considered not just another December rate increase but the possibility of a larger, 50-basis-point move. EUR/USD fell towards $1.1030, also its lowest since April 2025, while USD/JPY briefly crossed ¥160 for the first time since early September. The prospect of higher US returns supported both moves, although renewed warnings of Japanese intervention checked the dollar’s advance against the yen.
Top Regulated Brokers
US stocks nevertheless recovered some of the previous week’s losses, with the S&P 500 Index gaining 2.51%, the Nasdaq Composite rising 2.27% and the Dow advancing 2.07%, despite renewed technology-led selling late in the week. NVIDIA remained a major source of turbulence following Jensen Huang’s resignation as CEO, with its shares losing approximately 13% over the week and touching fresh 52-week lows. However, a strong weekly rebound in the broader semiconductor index suggested that investors were differentiating between companies and rotating into competing suppliers rather than abandoning the AI theme outright. NVIDIA’s forthcoming earnings and Anthropic’s planned IPO consequently became important tests of whether enthusiasm for AI investment could withstand leadership uncertainty, valuation concerns and higher financing costs.
In Britain, GDP expanded 0.7% in the third quarter, up from 0.5% in the second, while September’s 0.2% monthly growth beat expectations of stagnation. Services and AI-related activity helped drive the expansion, offering some support to sterling and reducing the immediate case for a softer Bank of England stance. Nevertheless, the stronger domestic figures could not outweigh the dollar’s yield advantage and renewed momentum: GBP/USD traded around $1.32–$1.33, near a four-week low, rather than the much longer-term extreme seen in EUR/USD. The contrast illustrated the week’s central forex theme: resilient activity outside America provided only limited protection against a dollar rally powered by persistent US inflation and increasingly hawkish interest-rate expectations.
The Week Ahead: Key Data and Events to Watch
Next week has far fewer high-impact data points scheduled, but there will be a highly important release of US CPI (inflation) data. The coming week’s most important data points, in order of likely importance, are:
Fed Chair Warsh Speaks
US FOMC Meeting Minutes
US Retail Sales
UK CPI (inflation)
Canada CPI (inflation)
Bank of England Governor Bailey Speaks
RBA Governor Bullock Speaks
Australia Unemployment Rate
New Zealand Inflation Expectations
Monthly Forex Forecast: November 2026 Overview
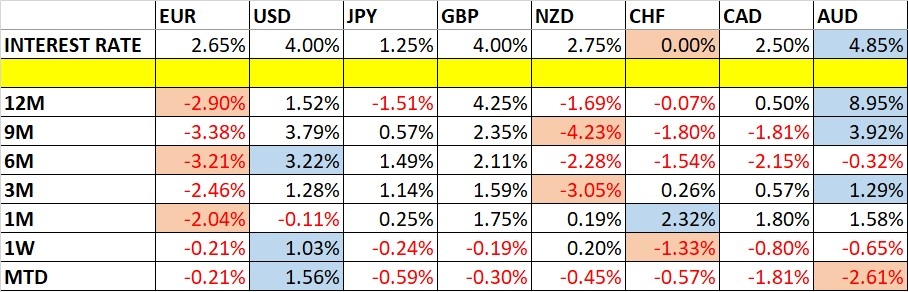
For the month of November, I forecasted that the EUR/USD currency pair will decline in value. Here is the performance to date:

Weekly Forecast 15th November 2026
Last week, I forecasted that the GBP/AUD and EUR/AUD currency crosses would fall in value over the week. Unfortunately, they both rose strongly, by 2.40% and 2.56% respectively.
Volatility declined last week, with 26% of the notable currency pairs and crosses moving by more than 1% in value. Next week’s volatility is likely to be at a similar level or higher.
You can trade these forecasts in a real or demo Forex brokerage account.
Technical Overview and Key Levels
Key Support and Resistance on Major FX Pairs
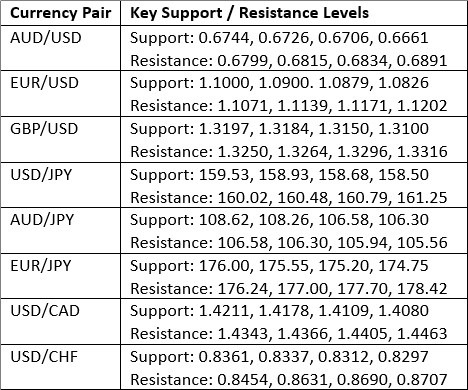
Key Support and Resistance Levels
US Dollar Index
The US Dollar Index (DXY) printed a large bullish candlestick, with a lower wick decisively rejecting the support level at 101.39. The price moved strongly higher and ended the week right on its high, which is a bullish sign. The price has reached a new 19-month high, another bullish sign. However, bulls should watch out for the resistance level at 103.23 which is very close by – this might provide some resistance to a further rise, even if temporary.
The trigger for the renewed strong bullishness on the greenback was the higher than expected US inflation data released last week, which has increased expectations that the Fed will be more inclined to hike rates at a steeper pace. According to the CME FedWatch Tool, the probability of a 0.50% rate hike at the Fed's December meeting has risen to 12%. The market sees some hike then as certain.
I think it is wise to look for trades that are long of the US Dollar over the coming week.
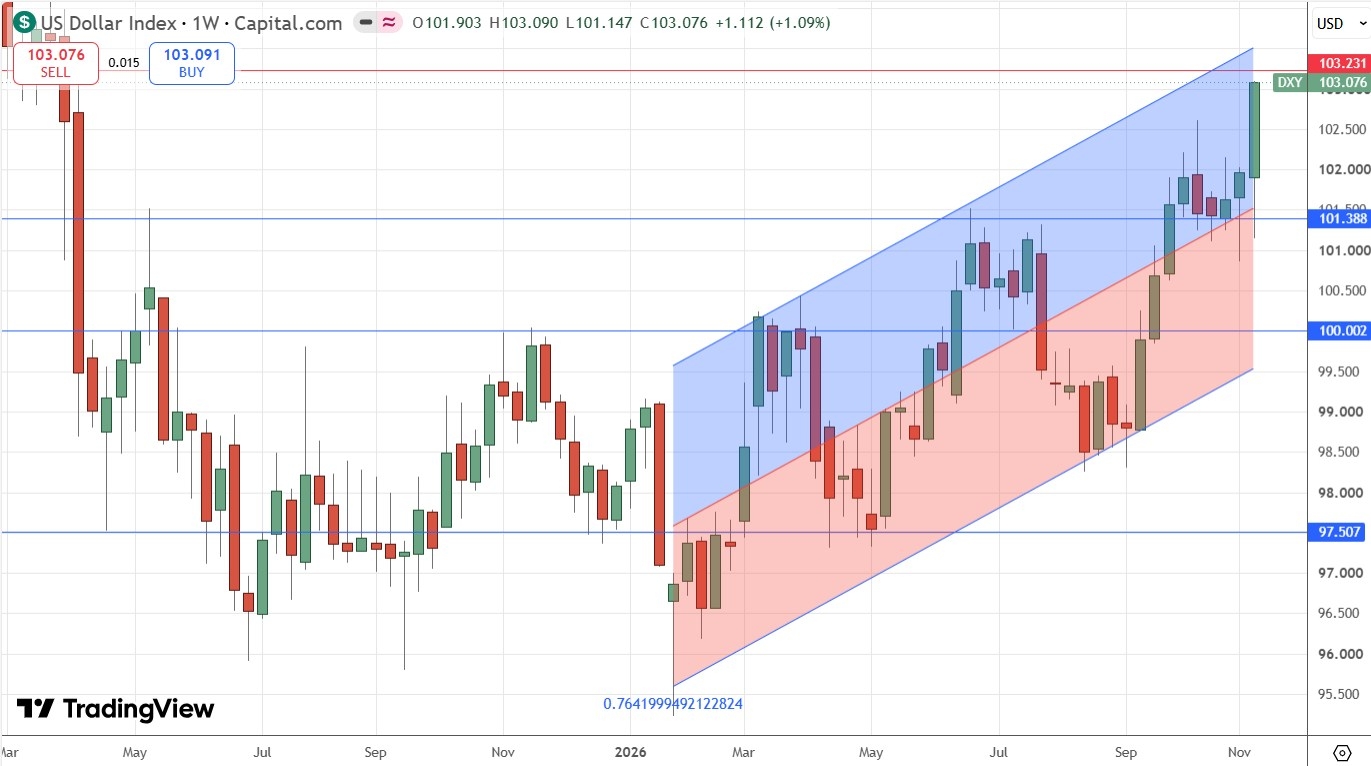
US Dollar Index Weekly Price Chart – Fresh 19-Month High
EUR/USD
The EUR/USD currency pair fell firmly last week, closing right on its low and reaching a record 19-month price, just like the US Dollar Index (DXY) covered above, which is not a surprise.
The price is obviously in a long-term bearish trend, and the Euro is a good vehicle to be short of against the US Dollar, as it is one of the weaker major currencies for fundamental reasons of energy and debt.
I am very comfortable remaining short, especially as this currency pair has historically tended to trend very reliably.
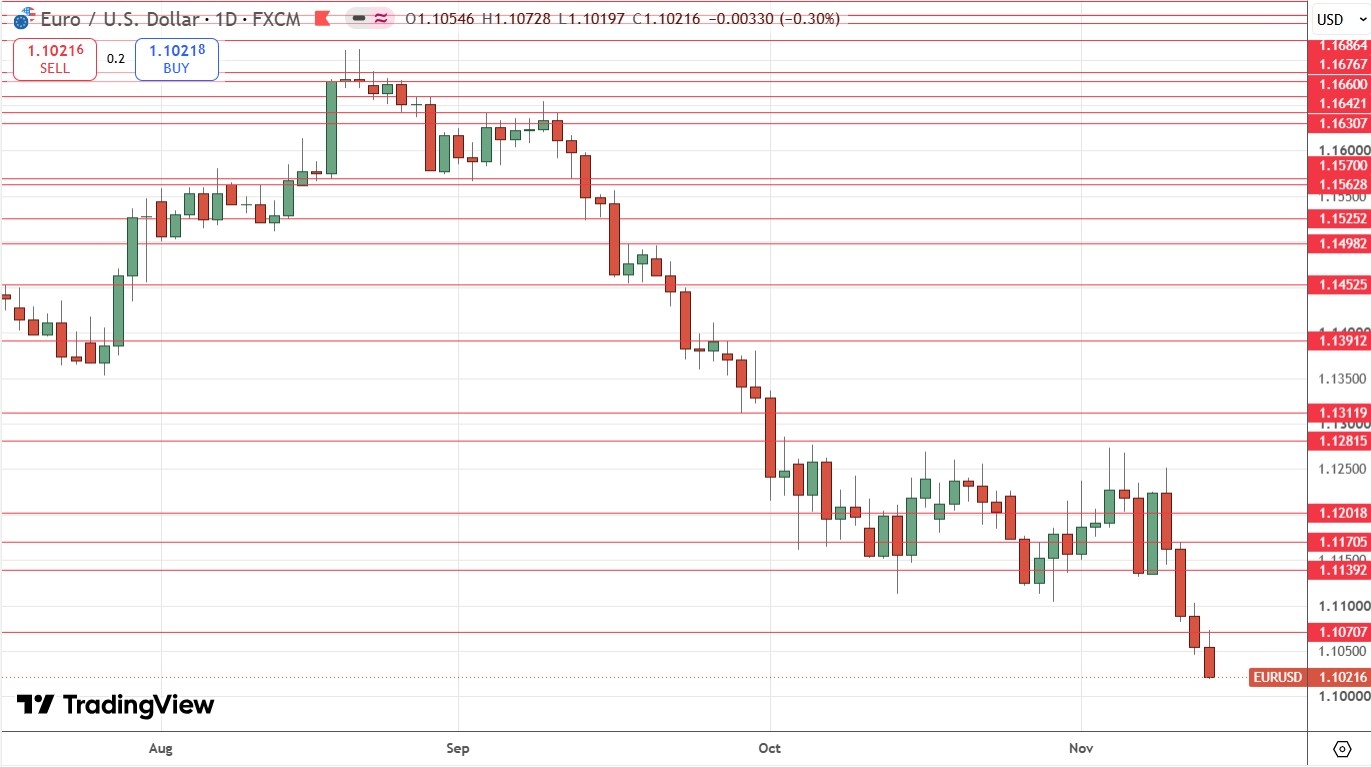
EUR/USD Daily Price Chart – Mirroring the DXY
USD/CAD
The USD/CAD currency pair rose strongly last week, respecting technical support levels and getting close to a new long-term high. The US Dollar strength is obvious. The Loonie's relative weakness has a lot to do with the lower price of Crude Oil with which it is usually positively correlated as a major oil producer.
The key question now is what will happen now the price is approaching close to a major bearish inflection zone at $1.4300, which is also a long-term high. There will certainly be sellers stepping in here, but will it be enough to halt the rise?
Taking a closer look at the daily price chart below, we can see there have been a series of higher highs and lows over the long term, with very wide swings between them, which strengthens the case for a further advance beyond $1.4300.
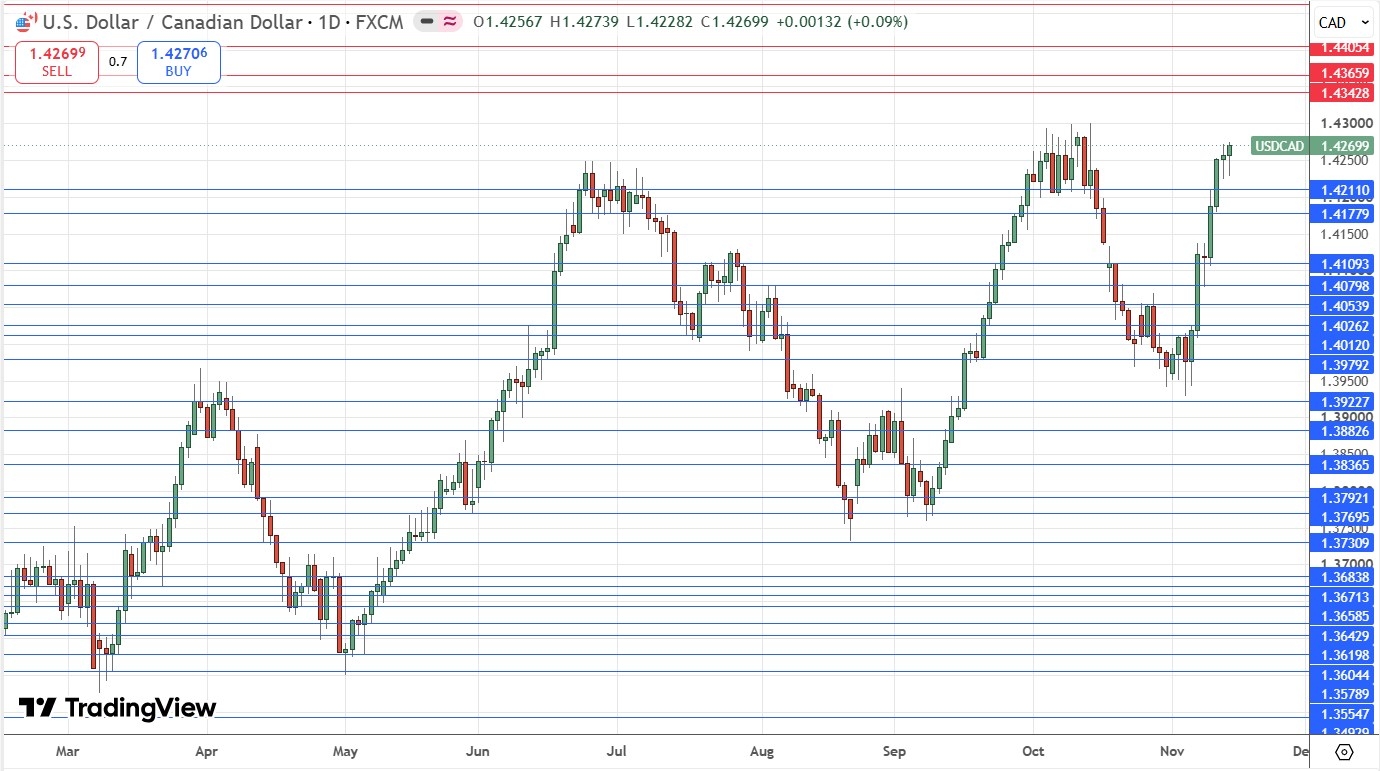
USD/CAD Daily Price Chart – Approaching Long-Term High at $1.4300
S&P 500 Index
The broad US stock market, represented by the S&P 500 Index, has its first week of gains in a few weeks. The price briefly traded below its 200-day simple moving average before bouncing off it, which is a common thing to happen when that moving average has not been touched for a while, as was the case here. However, the weekly gain was not very strong and was not convincing enough to make me feel that we are going to see a further gain next week.
Another reason for my bearish feeling is that the price action since early August has been contained within a symmetrical descending price channel, which I have drawn within the price chart below. Such channels can be technically powerful. I would want to see a breakout above this channel before I buy any more of this Index.
Another factor keeping the picture somewhat bearish is the higher-than-expected US CPI (inflation) data which was released last week, which boosted US treasury yields and sentiment that US interest rates will remain at relatively elevated levels for some considerable time into the future. This is bound to weigh on equities to some extent.
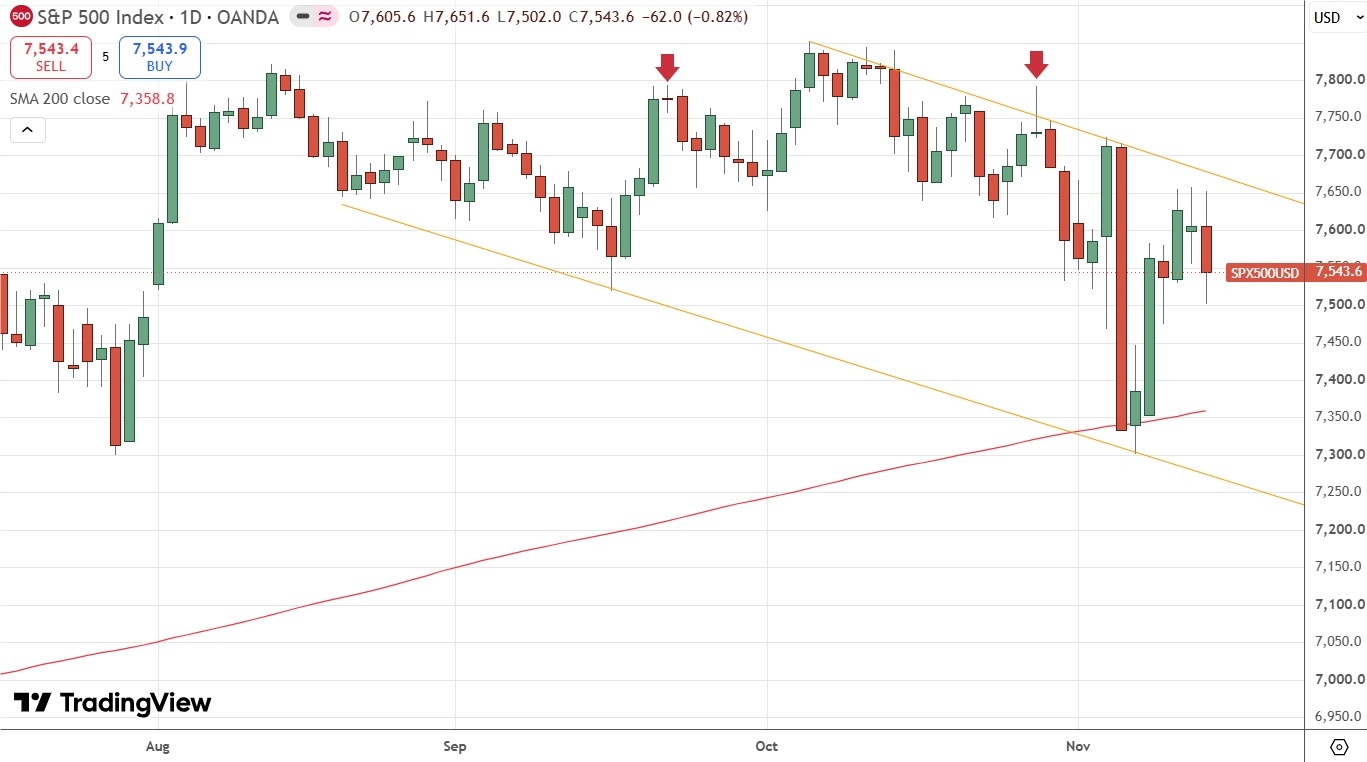
S&P 500 Index Daily Price Chart – Sharp Fall
Bitcoin/USD
Bitcoin broke down strongly below the support level near the major round number of $75,000 last week, falling all the way to the support level at $61,854. This was the lowest price Bitcoin has reached in four months.
Bitcoin has no intrinsic value outside of Africa and maybe a few other places, so I don't care to make a fundamental analysis of it – it is all sentiment, optimism, and technical factors. One advantage of that is that Bitcoin tends to respect technical chart factors quite strongly.
Looking at the price chart below, we can see that Bitcoin is making a bit of a bullish bounce from that low I mentioned earlier, and that when the price was last in this area, it was happy to consolidate for some time. So, I think there is a good chance that the fall has stopped for some time and we may now see another consolidation. Whether that means it is worth a buy now, is anyone's guess.
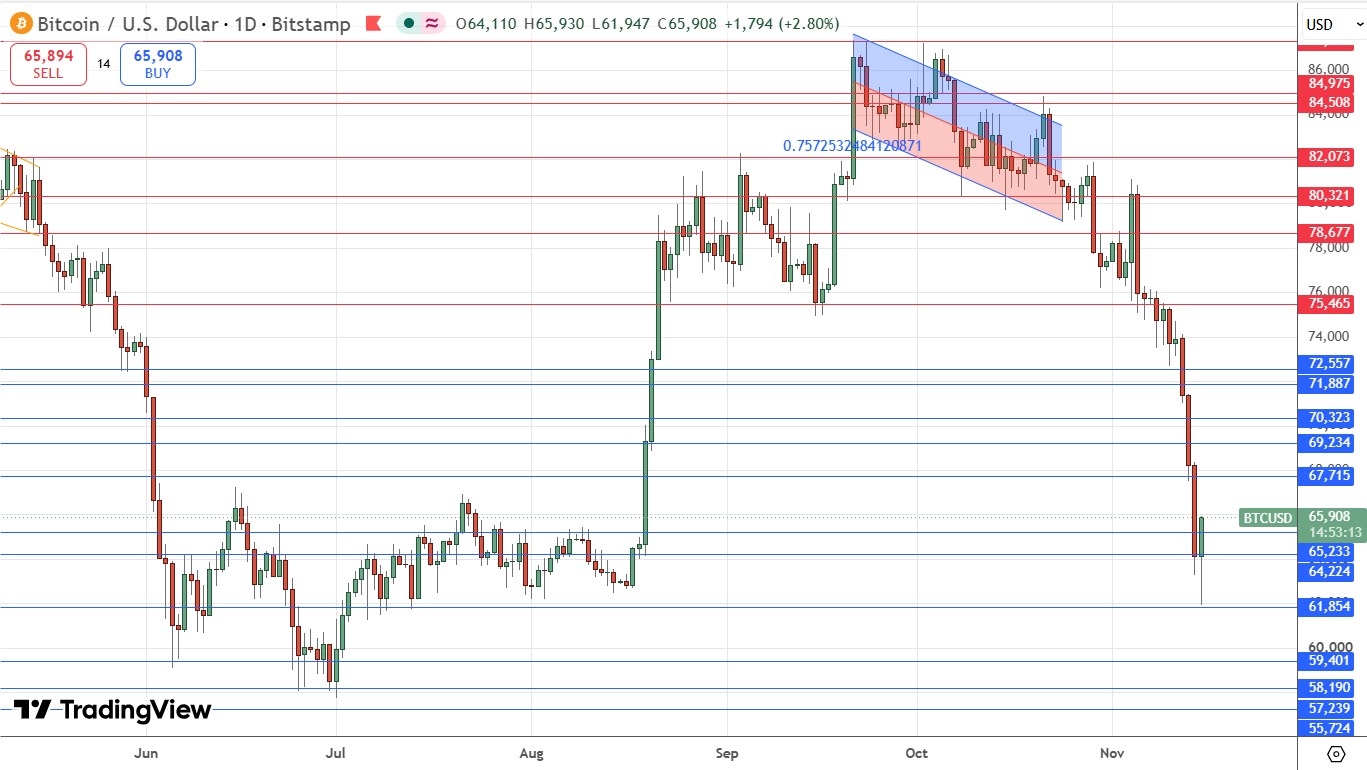
Bitcoin Daily Price Chart – Back to Base Terrirory?
Bottom Line
I see the best trades this week as:
Short of the EUR/USD currency pair.
Ready to trade our Forex weekly forecast? Check out our list of the best Forex brokers.