The Turkish lira continues to fall against the dollar without any significant correction.
Technical Analysis
The following are the most recent pieces of Forex technical analysis from around the world. The Forex technical analysis below covers the various currencies on the market and the most recent trends, technical indicators, as well as resistance and support levels.


The Turkish lira continues to fall against the dollar without any significant correction.
Spot natural gas prices (CFDS ON NATURAL GAS) rose in their recent trading at the intraday levels, to achieve daily gains until the moment of writing this report, by 0.92%.
The Dow Jones Industrial Average rose during its recent trading at the intraday levels, to achieve gains for the second day in a row, by 0.08%, to gain 26.76 points.
The West Texas Intermediate Crude Oil market initially pulled back on Monday but turned around to show signs of strength again.
The US dollar initially rallied on Monday but gave back gains rather quickly as the WTI Crude Oil market strengthened.
SOL/USD is within sight of highs recently made, but the incremental gains attained by Solana remain under the shadow of speculative unease.
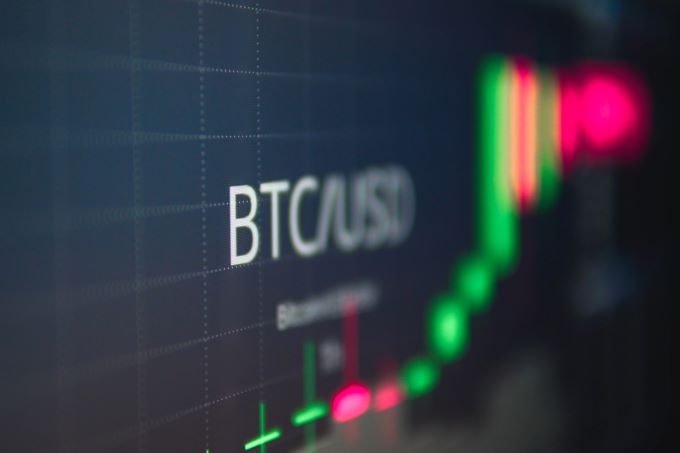
BTC/USD is within an uneasy price range as it continues to linger unsteadily, leaving speculators with questions regarding their perceptions.
The German DAX index gapped slightly higher to kick off the Monday future session but then fell rather hard.
The S&P 500 did very little on Monday as we have run out of momentum.
The French DAX Index initially fell on Monday but found buyers underneath at the €6280 level.
The euro rallied just a bit on Monday to show signs of life again, but at this point, it seems that the market is in a strong downtrend.
Unlike most of the crypto market, Monero took off to the upside on Monday, gaining 15%.
The Ethereum market initially tried to rally on Monday, but then gave back the gains to form a less-than-impressive candlestick.
The US dollar went back and forth on Monday as we are hanging about the area just above the 1.39 level.
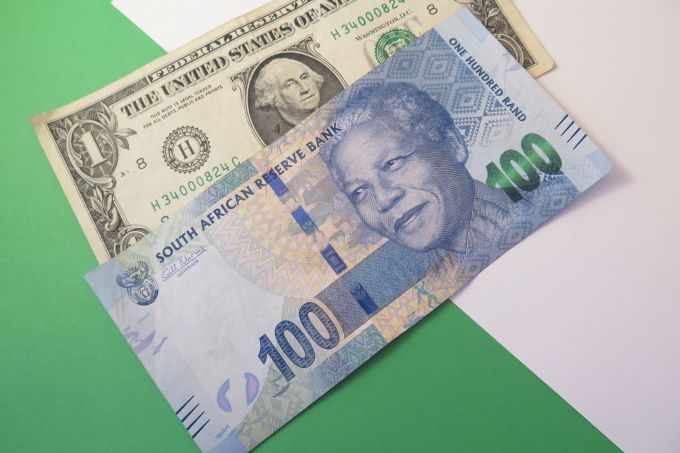
The US dollar went back and forth on Monday as we continue to threaten a major breakout against the South African rand.


.jpeg)