USD/JPY retreats from 158 resistance, with thin holiday trading offering pullback opportunities, while long-term momentum favors eventual upside breakout.
The following are the most recent pieces of Forex technical analysis from around the world. The Forex technical analysis below covers the various currencies on the market and the most recent trends, technical indicators, as well as resistance and support levels.
Most Recent
Gold remains under pressure near $2,600, with rising US rates and thin liquidity capping momentum, while key levels at $2,645 and $2,700 define its range.
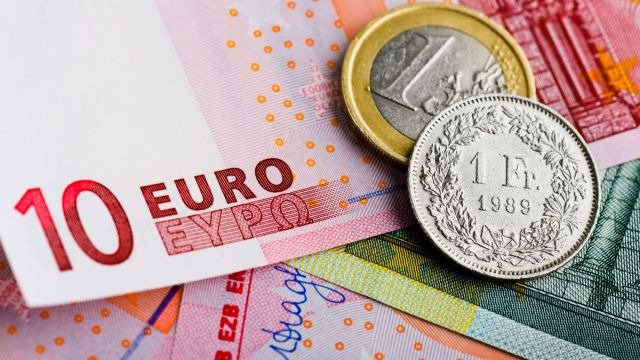
In my daily analysis of major currencies, the EUR/CHF pair has captured my attention due to the fact that we are getting close to the top of the recent range.
Top Regulated Brokers
In my daily analysis of the crypto markets, Ethereum captures my attention because we have just seen a typical technical analysis move play out.
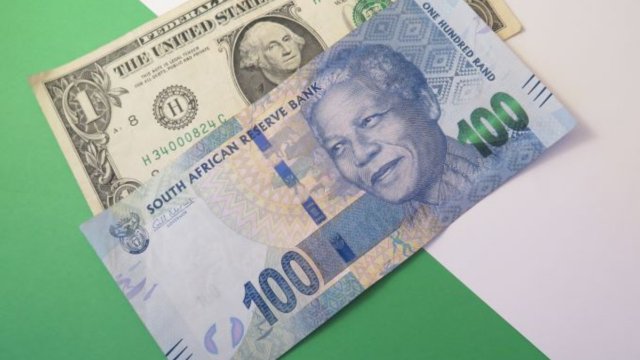
The USD/ZAR is a solid example of the broad Forex market as trading begins during this holiday week and nervousness remains a factor among financial institutions.
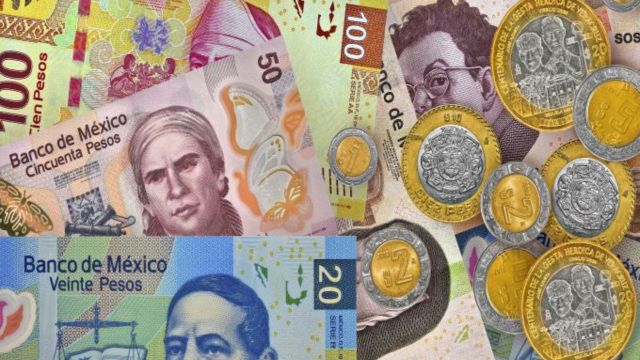
The USD/MXN has gained slightly upwards in trading the past couple of days, but this has taken place in thin market conditions and correlated with USD centric strength which has been exhibited.
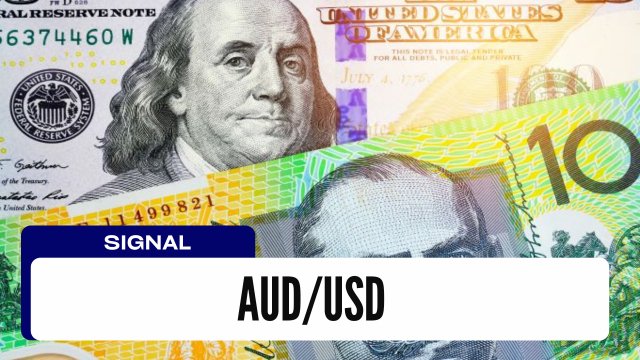
The Australian dollar has continued its downward trend as it fell for five consecutive weeks, reaching its lowest level since October 2022.
The EUR/USD exchange rate remained in a tight range on Monday morning ahead of a relatively muted week for the forex market.
The BTC/USD pair has formed a high-risk pattern, pointing to more downside in the next few weeks.
Bonuses & Promotions
The GBP/USD finished the week near the 1.25700 level, as the lower range of the currency pair continues to see plenty of tests and nervous sentiment appears to be creating headwinds.
The holiday week sees a quiet Forex market favouring the US Dollar and punishing commodity currencies, while stock markets advance before taking a knock at the end of the week.
Markets show mixed activity with Gold holding an uptrend, currency pairs staying range-bound, Bitcoin faltering, and indices subdued amid holiday trading.
This past Friday WTI Crude Oil finished the week within eyesight of the 70.000 USD mark, but the closing price of nearly 69.875 was close to the previous week’s close of 69.500.
The Euro sees a modest bounce but faces strong resistance at 1.06, as political instability and economic slowdown in the EU favor continued bearish pressure.
GBP/USD remains lackluster near 1.25, with thin trading favoring sideways movement and potential downside as interest rate dynamics support the US dollar.

