
Short Trade Idea
Enter your short position between $44.45 (Friday’s intra-day low) and $48.13 (Friday’s intra-day high).
Market Index Analysis
- Intel (INTC) is a member of the NASDAQ 100, the Dow Jones Industrial Average, the S&P 100, and the S&P 500 indices.
- All four indices trade off their highs with rising bearish trading volumes.
- The Bull Bear Power Indicator of the NASDAQ 100 turned positive but remains below its descending trendline.
Market Sentiment Analysis
Equity futures are pointing lower this morning, following two weeks of losses, ahead of the busiest week of earnings season. Gold surged past $5,000 per ounce as geopolitical tensions and economic issues continue to rise. On the earnings front, Microsoft, Meta, Tesla, and Apple will dominate headlines later this week. The US Fed is expected to keep interest rates on hold this week, but markets will focus on its outlook and more details about the next Fed Chair, with BlackRock’s Rick Rieder rumored to be a favorite.
Intel Fundamental Analysis
Intel is a technology company that primarily designs CPUs for business and consumer markets. It lost its leadership position to AMD and missed out on the AI wave, while its future chips will rely heavily on TSMC.
So, why am I bearish on INTC following its earnings disappointment?
While Intel reported revenues of $13.7 billion and earnings per share of $0.15, beating expectations of $13.4 billion and $0.08, respectively, its outlook disappointed. Its diluted EPS was negative at $0.12 compared to a net loss of $0.03 in the comparable 2025 quarter. Intel also noted that it will not rush a costly chip buildout, faces insider selling, and I am bearish on its outlook, rising diluted EPS, and valuations.
Metric | Value | Verdict |
P/E Ratio | 88.08 | Bearish |
P/B Ratio | 1.97 | Bullish |
PEG Ratio | 0.50 | Bullish |
Current Ratio | 1.33 | Bearish |
ROIC-WACC Ratio | Negative | Bearish |
The price-to-earnings (P/E) ratio of 88.08 makes INTC an expensive stock. By comparison, the P/E ratio for the NASDAQ 100 is 35.18.
The average analyst price target for INTC is $46.09. It shows negligible upside potential with increasing downside risks.
Intel Technical Analysis
Today’s INTC Signal
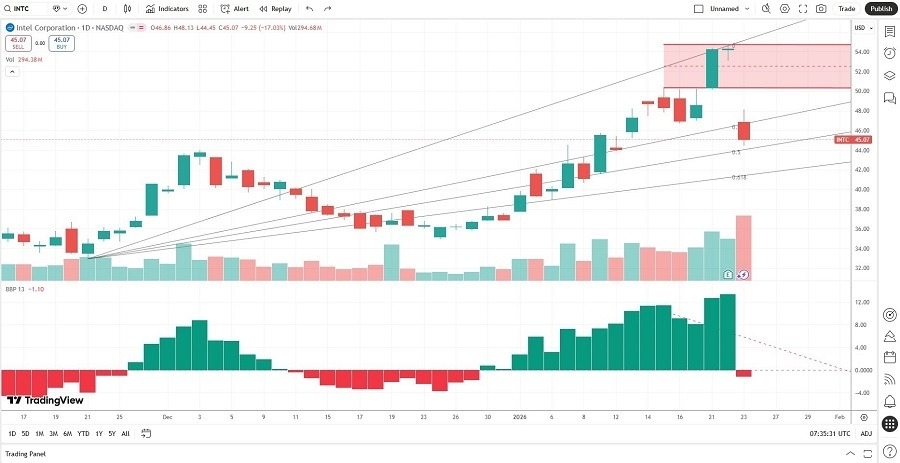
- The INTC D1 chart shows price action breaking down below its horizontal resistance zone.
- It also shows price action between its ascending 38.2% and 50.0% Fibonacci Retracement Fan levels.
- The Bull Bear Power Indicator turned bearish with a descending trendline.
- The average bearish trading volumes are higher than the average bullish trading volumes and spiked during the breakdown.
- INTC corrected with the NASDAQ 100 Index, a bearish confirmation.
My INTC Short Stock Trade
- INTC Entry Level: Between $44.45 and $48.13
- INTC Take Profit: Between $28.73 and $32.89
- INTC Stop Loss: Between $50.39 and $52.50
- Risk/Reward Ratio: 2.65
Ready to trade our analysis of Intel? Here is our list of the best stock brokers worth reviewing.