
Long Trade Idea
Enter your long position between $323.62 (this week’s intra-day low) and $331.04 (yesterday’s intra-day high).
Market Index Analysis
- Visa (V) is a member of the Dow Jones Industrial Average, and the S&P 100 and S&P 500 indices.
- All three indices trade in bearish chart patterns with rising downside catalysts.
- The Bull Bear Power Indicator of the S&P 500 Index is bullish, but below its descending trendline.
Market Sentiment Analysis
Equity futures are moving higher after January’s NFP report came in much stronger than expected. The focus is now back on the Fed, where views differ on how many interest rate increases are ahead. Still, annual revisions could show over 600,000 fewer jobs than previously reported. Friday’s CPI report will provide the next inflation snapshot. Cisco tumbled in after-hours action following the release of its earnings report, while McDonald’s also slipped. Earnings from Applied Materials and Coinbase could move markets today. Oil prices are rising amid heightened US-Iranian tensions, which may keep markets on edge.
Visa Fundamental Analysis
Visa is one of the world’s top three payment card service providers and the largest outside China. It facilitates electronic funds transfers globally.
So, why am I bullish on V after its earnings beat?
The latest earnings showed revenues of $10.90 billion with earnings per share of $3.17, beating estimates of $10.69 billion and $3.14, respectively. Payment volume exceeded $4 trillion, but I remain bullish on Visa amid its technological innovation, including its exploration of a role in a digital Euro. Value-added services contributed nearly 50% of total revenue growth, indicating notable revenue diversification. Visa has nearly three times as many digital tokens as physical cards, and tap-to-pay accounts for more than 80% of face-to-face transactions, driving user engagement and enhancing security. I am also bullish about its digital and stablecoin footprint.
Metric | Value | Verdict |
P/E Ratio | 30.97 | Bearish |
P/B Ratio | 16.56 | Bearish |
PEG Ratio | 1.81 | Bullish |
Current Ratio | 1.11 | Bearish |
ROIC-WACC Ratio | Positive | Bullish |
The price-to-earnings (P/E) ratio of 30.97 makes V an expensive stock. By comparison, the P/E ratio for the S&P 500 is 29.65.
The average analyst price target for V is $400.41, suggesting good upside potential with reasonable downside risk.
Visa Technical Analysis
Today’s V Signal
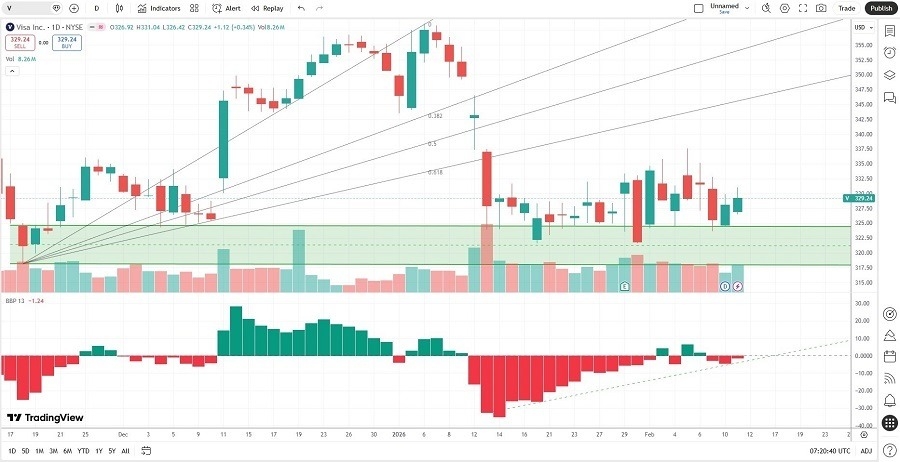
- The V D1 chart shows a price action breaking out above its horizontal support zone.
- It also shows price action below its ascending Fibonacci Retracement Fan.
- The Bull Bear Power Indicator is bearish but remains above its ascending trendline.
- The average bearish trading volumes are higher than the average bullish trading volumes, hinting at short-term volatility.
- V advanced less than the S&P 500 Index, a bearish signal, but bullish catalysts are rising.
My V Long Stock Trade
- V Entry Level: Between $323.62 and $331.04
- V Take Profit: Between $388.40 and $400.41
- V Stop Loss: Between $294.78 and $299.00
- Risk/Reward Ratio: 2.25
Ready to trade our analysis of Visa? Here is our list of the best stock brokers worth reviewing.