
Short Trade Idea
Enter your short position between $222.64 (yesterday’s intra-day low) and $227.61 (yesterday’s intra-day high).
Market Index Analysis
Honeywell International (NASDAQ:HON) is a member of the Dow Jones Industrial Average Index, the NASDAQ 100 Index, the S&P 100 Index, and the S&P 500 Index.
All four indices are trending lower inside bearish price channels with heightened downside risks.
The Bull Bear Power Indicator for the S&P 500 Index is bearish with a descending trendline.
Market Sentiment Analysis
Equity futures point to a bearish open amid conflicting reports over a truce between the US and Israel. Still, equity markets are on track to break a four-week bearish streak, barring a significant sell-off at the end of this week. Iran is drafting a law to introduce tolls for passage of the Strait of Hormuz. US recession risks have spiked amid the impact of high oil prices on consumers. Google’s TurboQuant technology breakthrough claims to limit memory usage, sending memory and disk makers tumbling.
Honeywell International Fundamental Analysis
Honeywell International is a conglomerate with aerospace, building automation, industrial automation, and energy and sustainability solutions (ESS) at its core. Additionally, it operates Sandia National Laboratories and has a global workforce of over 100,000 employees.
So, why am I bearish on HON despite heightened defense demand?
While I remain bullish over the long-term on Honeywell International’s strategy, I see more medium-term downside driven by weakness in the petrochemical catalysts business. The 26% price cut in its acquisition of Johnson Matthey’s Catalyst Technologies unit was a significant red flag amid declining profitability, delayed projects, and lower demand. Current market conditions add to execution risks for its 2026 Aerospace spinoff and planned Quantinuum IPO.
Metric | Value | Verdict |
P/E Ratio | 32.58 | Bearish |
P/B Ratio | 10.13 | Bearish |
PEG Ratio | 2.01 | Bearish |
Current Ratio | 1.30 | Bearish |
ROIC-WACC Ratio | Positive | Bullish |
Honeywell International Fundamental Analysis Snapshot
The price-to-earnings (P/E) ratio of 32.58 makes HON an expensive stock. By comparison, the P/E ratio for the S&P 500 Index is 26.12.
The average analyst price target for HON is $251.44. This suggests there is moderate upside potential, but downside risks are greater.
Honeywell International Technical Analysis
Today’s HON Signal
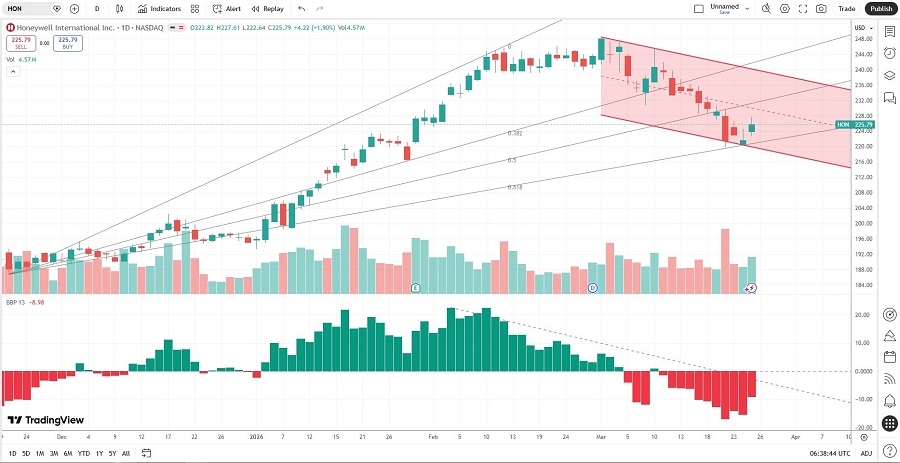
Honeywell International Price Chart
The HON D1 chart shows price action inside a bearish price channel.
It also shows price action between its ascending 50.0% and 61.8% Fibonacci Retracement Fan levels.
The Bull Bear Power Indicator is bearish with a descending trendline.
The average bearish trading volumes are higher than the average bullish trading volumes.
HON corrected with the S&P 500 Index, a bearish confirmation.
My HON Short Stock Trade
HON Entry Level: Between $222.64 and $227.61
HON Take Profit: Between $186.76 and $193.35
HON Stop Loss: Between $237.58 and $245.26
Risk/Reward Ratio: 2.40
Ready to trade our analysis of Honeywell International? Here is our list of the best stock brokers worth checking out.