
Long Trade Idea
Enter your long position between $193.92 (yesterday’s intra-day low) and $201.33 (the upper band of its horizontal support zone).
Market Index Analysis
Accenture (NYSE:ACN) is a member of the S&P 100 Index and the S&P 500 Index.
Both indices spiked higher yesterday, but low bullish trading volumes suggest caution ahead, as they do not confirm the recent six-day rally.
The Bull Bear Power Indicator for the S&P 500 Index turned bullish and spiked above its descending trendline.
Market Sentiment Analysis
Equity futures are drifting lower after Iran and the USA continue to argue about what are the binding points of the agreed ceasefire. The Strait of Hormuz remains functionally closed, which was one of the most core US demands. Oil prices are approaching $100 per barrel again, and markets await US PCE Price Index data, the Federal Reserve’s preferred inflation gauge.
Accenture Fundamental Analysis
Accenture is a multinational professional services company with over 770,000 employees, specializing in information technology (IT) services and management consulting. It operates five business units: Strategy and Consulting, Technology, Operations, Accenture Song, and Industry X.
So, why am I bullish on ACN at current levels?
I remain bullish on Accenture following its strategic acquisition of Keepler Data Tech, which bolsters its European AI and data capabilities. Its record advanced AI bookings of $2.2 billion last quarter confirm strong demand, with nearly all clients moving from proof-of-concept to full-scale production. I am also bullish on Accenture’s deepening partnerships with industry leaders, including Nvidia, Google Cloud, Databricks, and Palantir.
Metric | Value | Verdict |
P/E Ratio | 15.90 | Bullish |
P/B Ratio | 3.96 | Bearish |
PEG Ratio | 1.55 | Bullish |
Current Ratio | 1.34 | Bearish |
ROIC-WACC Ratio | Positive | Bullish |
Accenture Fundamental Analysis Snapshot
The price-to-earning (P/E) ratio of 15.90 makes ACN an inexpensive stock. By comparison, the P/E ratio for the S&P 500 Index is 24.33.
The average analyst price target for ACN is $252.00. This suggests excellent upside potential with fading downside risks.
Accenture Technical Analysis
Today’s ACN Signal
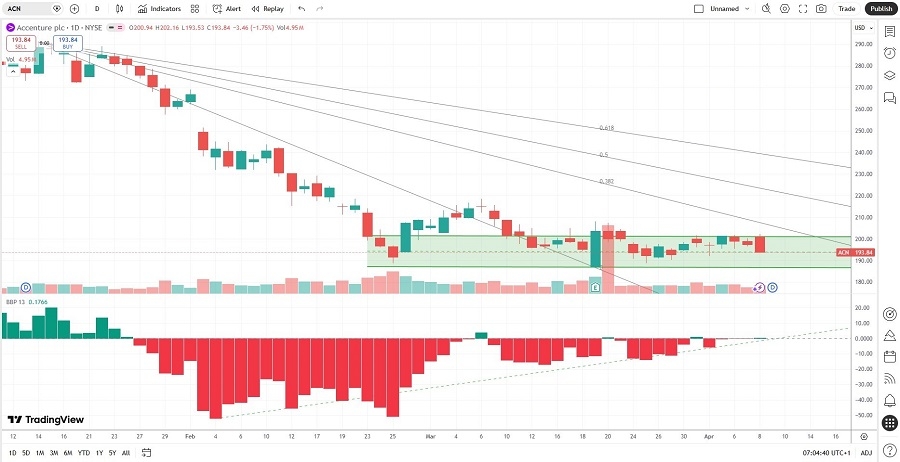
Accenture Price Chart
The ACN D1 chart shows price action inside its horizontal support zone.
It also shows price action between its descending 0.0% and 38.2% Fibonacci Retracement Fan levels.
The Bull Bear Power Indicator turned bullish with an ascending trendline.
The average bearish trading volumes are higher than the average bullish trading volumes, hinting at more short-term volatility.
ACN flatlined as the S&P 500 Index broke out, a bearish signal, but breakout catalysts are accumulating.
My ACN Long Stock Trade
ACN Entry Level: Between $193.92 and $201.33
ACN Take Profit: Between $251.55 and $258.00
ACN Stop Loss: Between $174.94 and $181.97
Risk/Reward Ratio: 3.04
Ready to trade our analysis of Accenture? Here is our list of the best stock brokers worth checking out.