
Short Trade Idea
Enter your short position between $213.00 (yesterday’s intra-day low) and $216.75 (the upper band of its horizontal resistance zone).
Market Index Analysis
Allstate (NYSE:ALL) is a member of the S&P 500 Index.
This index has recovered from the Iran war lows, but low bullish trading volumes flash a warning sign.
The Bull Bear Power Indicator for the S&P 500 Index is extremely bullish, making it vulnerable to a pullback.
Market Sentiment Analysis
Equity futures are hovering near the flatline amid renewed hopes of a lasting peace deal between the US and Iran. Oil prices are retreating toward $90 per barrel. Yesterday’s PPI data showed inflation rose less than expected, adding to bullish momentum, with the S&P 500 rising in nine of the last 10 sessions and the NASDAQ 100 up in the last 10 consecutive trading sessions. Bank of America and Morgan Stanley will report earnings before the bell.
Allstate Fundamental Analysis
Allstate is an insurance company and a Fortune 500 company. It has used the same advertising slogan since the 1950s and is one of the most recognized insurance companies.
So, why am I bearish on ALL at current levels?
Some expectations call for a 120%+ year-over-year increase in earnings per share in its upcoming earnings release, but I am wary of a muted outlook amid margin-compression risks. I am bearish because Allstate is raising prices while competitors are lowering them, increasing the risk of customer attrition. Climate risk exposure threatens underwriting margins, and Allstate already reported $249 million during the January-February period.
Metric | Value | Verdict |
P/E Ratio | 5.65 | Bullish |
P/B Ratio | 1.94 | Bullish |
PEG Ratio | 0.47 | Bullish |
Current Ratio | 0.37 | Bearish |
ROIC-WACC Ratio | Negative | Bearish |
Allstate Fundamental Analysis Snapshot
The price-to-earning (P/E) ratio of 5.65 makes ALL an inexpensive stock. By comparison, the P/E ratio for the S&P 500 Index is 29.92.
The average analyst price target for ALL is $239.43. This suggests moderate upside potential with rising downside risks.
Allstate Technical Analysis
Today’s ALL Signal
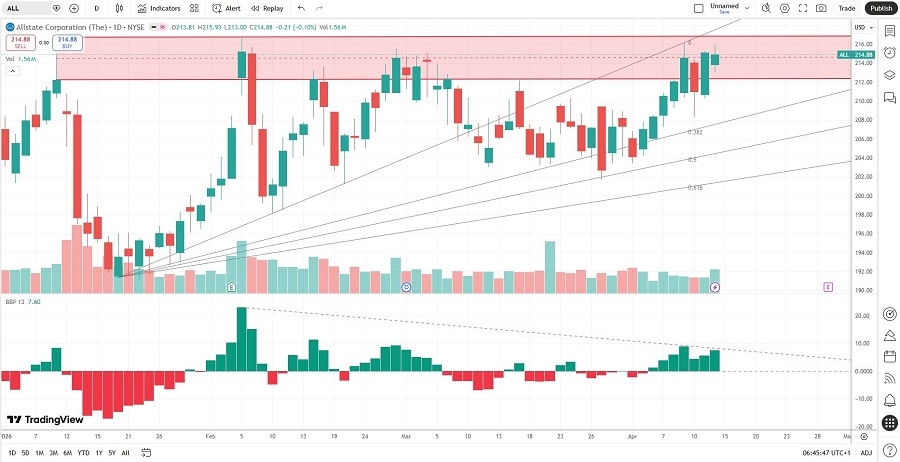
Allstate Price Chart
The ALL D1 chart shows price action inside its horizontal resistance zone.
It also shows price action between its ascending 0.0% and 38.2% Fibonacci Retracement Fan levels.
The Bull Bear Power Indicator is bullish with a descending trendline.
The average bearish trading volumes are higher than the average bullish trading volumes.
ALL moved higher with the S&P 500 Index, a bullish confirmation, but breakdown catalysts are rising.
My ALL Short Stock Trade
ALL Entry Level: Between $213.00 and $216.75
ALL Take Profit: Between $176.00 and $180.00
ALL Stop Loss: Between $227.59 and $232.14
Risk/Reward Ratio: 2.54
Ready to trade our analysis of Allstate? Here is our list of the best stock brokers worth checking out.