
Long Trade Idea
Enter your long position between $1,062.99 (an intermediate horizontal support level) and $1,073.96 (yesterday’s intra-day high).
Market Index Analysis
- BlackRock (NYSE:BLK) is a member of the S&P 100 Index and the S&P 500 Index.
- Both indices have recovered from the Iran war lows, but low bullish trading volumes flash a warning sign.
- The Bull Bear Power Indicator for the S&P 500 Index is extremely bullish, making it vulnerable to a pullback.
Market Sentiment Analysis
Equity futures are hovering near the flatline amid renewed hopes of a lasting peace deal between the US and Iran. Oil prices are retreating toward $90 per barrel. Yesterday’s PPI data showed inflation rose less than expected, adding to bullish momentum, with the S&P 500 rising in nine of the last 10 sessions and the NASDAQ 100 up in the last 10 consecutive trading sessions. Bank of America and Morgan Stanley will report earnings before the bell.
BlackRock Fundamental Analysis
BlackRock is a multinational investment company, the world’s largest asset manager with over $13.5 trillion in assets under management, and one of the Big Four index fund managers, managing the iShares ETF group.
So, why am I bullish on BLK after its earnings release?
BlackRock reported revenues of $6.70 billion and earnings per share of $12.53, eclipsing expectations of $6.55 billion and $11.65, respectively. I remain bullish amid massive inflows of $130 billion led by passive investment instruments. I am equally bullish on its AI-centered investment strategy, especially its expansion into South Korea, China, and Taiwan. Its portfolio shifts to reflect the current environment and thematic opportunities, which should provide a tailwind.
Metric | Value | Verdict |
P/E Ratio | 26.52 | Bullish |
P/B Ratio | 2.85 | Bearish |
PEG Ratio | 1.29 | Bullish |
Current Ratio | 2.04 | Bullish |
ROIC-WACC Ratio | Negative | Bearish |
BlackRock Fundamental Analysis Snapshot
The price-to-earning (P/E) ratio of 26.52 makes BLK an inexpensive stock. By comparison, the P/E ratio for the S&P 500 Index is 29.92.
The average analyst price target for BLK is $1,225.06. This suggests excellent upside potential with manageable downside risk.
BlackRock Technical Analysis
Today’s BLK Signal
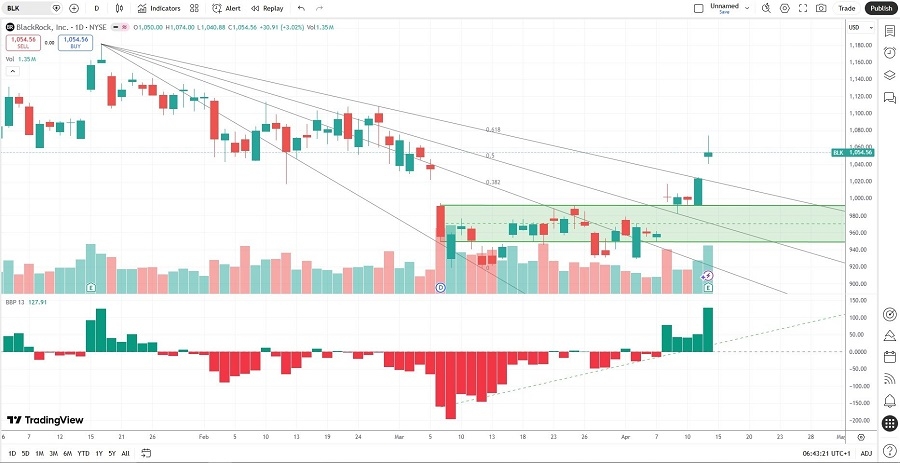
BlackRock Price Chart
- The BLK D1 chart shows price action breaking out above its horizontal support zone.
- It also shows price action breaking out above its descending Fibonacci Retracement Fan.
- The Bull Bear Power Indicator is bullish with an ascending trendline.
- The average bullish trading volumes are higher than the average bearish trading volumes since the breakout.
- BLK advanced with the S&P 500 Index, a bullish confirmation.
My BLK Long Stock Trade
- BLK Entry Level: Between $1,062.99 and $1,073.96
- BLK Take Profit: Between $1,225.06 and $1,237.31
- BLK Stop Loss: Between $982.22 and $991.96
- Risk/Reward Ratio: 2.01
Ready to trade our analysis of BlackRock? Here is our list of the best stock brokers worth checking out.