
Long Trade Idea
Enter your long position between $674.55 (yesterday’s intra-day low) and $681.68 (yesterday’s intra-day high).
Market Index Analysis
Northrop Grumman (NYSE:NOC) is a member of the S&P 500 Index.
This index has recovered from the Iran war lows, but low bullish trading volumes flash a warning sign.
The Bull Bear Power Indicator for the S&P 500 Index is extremely bullish, making it vulnerable to a pullback.
Market Sentiment Analysis
Equity futures are hovering near the flatline amid renewed hopes of a lasting peace deal between the US and Iran. Oil prices are retreating toward $90 per barrel. Yesterday’s PPI data showed inflation rose less than expected, adding to bullish momentum, with the S&P 500 rising in nine of the last 10 sessions and the NASDAQ 100 up in the last 10 consecutive trading sessions. Bank of America and Morgan Stanley will report earnings before the bell.
Northrop Grumman Fundamental Analysis
Northrop Grumman is an aerospace and defense company. NOC is the 5th largest US government contractor and receives over 2% of federal government spending on contractors.
So, why am I bullish on NOC ahead of its earnings release?
I expect an earnings surprise next week with an upbeat outlook driven by its record backlog exceeding $95 billion. I am bullish on its participation in the US Air Force’s Sentinel ICBM initiative and the B-21 Raider stealth bomber program. International sales add another tailwind, together with ammunition replenishment and strong demand for missile defense systems. NOC continues to sign fresh contracts, confirming revenue stability and defense technology leadership.
Metric | Value | Verdict |
P/E Ratio | 23.38 | Bullish |
P/B Ratio | 5.80 | Bearish |
PEG Ratio | 5.17 | Bearish |
Current Ratio | 1.10 | Bearish |
ROIC-WACC Ratio | Positive | Bullish |
Northrop Grumman Fundamental Analysis Snapshot
The price-to-earning (P/E) ratio of 23.38 makes NOC an inexpensive stock. By comparison, the P/E ratio for the S&P 500 Index is 29.92.
The average analyst price target for NOC is $736.10. This suggests good upside potential with decreasing downside risk.
Northrop Grumman Technical Analysis
Today’s NOC Signal
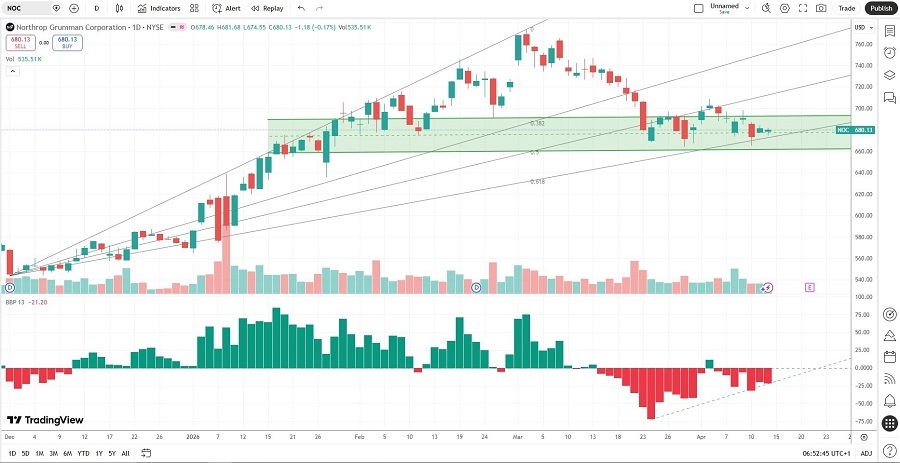
Northrop Grumman Price Chart
The NOC D1 chart shows price action inside its horizontal support zone.
It also shows price action between its ascending 50.0% and 61.8% Fibonacci Retracement Fan levels.
The Bull Bear Power Indicator is bearish with an ascending trendline.
The average bullish trading volumes are higher than the average bearish trading volumes.
NOC flatlined as the S&P 500 Index rallied, a bearish signal, but breakout catalysts are accumulating.
My NOC Long Stock Trade
NOC Entry Level: Between $674.55 and $681.68
NOC Take Profit: Between $765.58 and $774.00
NOC Stop Loss: Between $632.98 and $636.00
Risk/Reward Ratio: 2.19
Ready to trade our analysis of Northrop Grumann? Here is our list of the best stock brokers worth checking out.