
Short Trade Idea
Enter your short position between $377.98 (Friday’s opening price) and $391.06 (an intermediate horizontal resistance level).
Market Index Analysis
Alphabet (NASDAQ:GOOG) is a member of the NASDAQ 100 Index, the S&P 100 Index, and the S&P 500 Index.
All three indices are climbing a wall of worry and ignoring medium-term issues that accumulate.
The Bull Bear Power Indicator for the NASDAQ 100 Index is bullish with a negative divergence.
Market Sentiment Analysis
Equity futures hover near record highs despite ongoing tensions over the Strait of Hormuz. Meme stock GameStop made a bold acquisition offer for e-commerce retailer eBay, trying to compete with Amazon at a $56 billion price tag, a move that had been rumored for weeks. Lattice Semiconductor Corporation, Advanced Micro Devices, Arm Holdings, Palantir, and Paramount Skydance highlight this week’s earnings reports.
Alphabet Fundamental Analysis
Alphabet is a technology conglomerate holding company, the largest technology company by profit and the third largest by revenue globally. It is a hyperscaler in the AI sector and a significant player in driverless technology with its Waymo brand.
So, why am I bearish on GOOG despite its earnings beat?
Alphabet reported revenue of $109.9 billion and earnings per share of $5.11, ahead of estimates calling for $107.2 billion and $2.62, respectively. While I remain long-term bullish on Alphabet, driven by its AI segment, Waymo expansion, and autonomous driving momentum, its announced $175 to $185 billion capital expenditure guidance for 2026 and cash flow concerns make me a short- to medium-term bear.
Metric | Value | Verdict |
P/E Ratio | 29.23 | Bullish |
P/B Ratio | 9.70 | Bearish |
PEG Ratio | 1.78 | Bullish |
Current Ratio | 1.92 | Bearish |
ROIC-WACC Ratio | Positive | Bullish |
Alphabet Fundamental Analysis Snapshot
The price-to-earnings (P/E) ratio of 29.23 makes GOOG an inexpensive stock. By comparison, the P/E ratio for the NASDAQ 100 Index is 36.16.
The average analyst price target for GOOG is $400.24. This suggests limited upside potential with rising downside risks.
Alphabet Technical Analysis
Today’s GOOG Signal
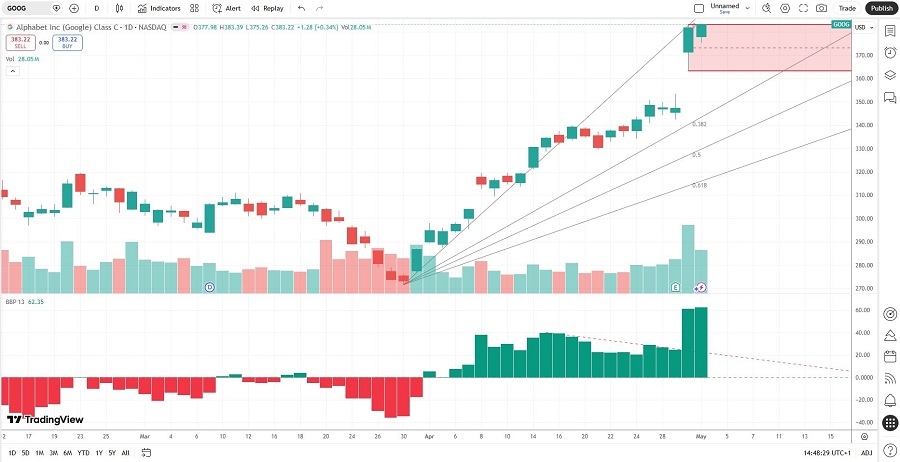
Alphabet Price Chart
The GOOG D1 chart shows price action forming a new horizontal resistance zone.
It also shows price action between its ascending 0.0% and 38.2% Fibonacci Retracement Fan levels.
The Bull Bear Power Indicator spiked into unsustainable bullish conditions above its descending trendline.
The average bullish trading volumes are higher than the average bearish trading volumes, suggesting more short-term volatility potential.
GOOG rallied with the NASDAQ 100 Index, a bullish confirmation, but breakdown catalysts are accumulating.
My GOOG Short Stock Trade
GOOG Entry Level: Between $377.98 and $391.06
GOOG Take Profit: Between $321.15 and $329.63
GOOG Stop Loss: Between $404.24 and $412.33
Risk/Reward Ratio: 2.16
Ready to trade our analysis of Alphabet? Here is our list of the best stockbrokers worth checking out.