
Long Trade Idea
Enter your long position between $82.05 (an intermediate horizontal support level) and $88.20 (yesterday’s intra-day high).
Market Index Analysis
Atlassian (NASDAQ:TEAM) is a member of the NASDAQ 100 Index.
This index retreated from all-time highs amid rising inflation and decreasing wages but remains excessively high and disconnected from economic reality.
The Bull Bear Power Indicator for the NASDAQ 100 Index is bullish with a negative divergence.
Market Sentiment Analysis
Equity futures are moderately recovering following yesterday’s mostly bearish sessions after April’s CPI report came in higher than expected at 3.8% annually, while real average hourly wages decreased 0.5% monthly and 0.3% annually. US President Trump will travel to China to meet President Xi, and Cisco Systems and Alibaba Group earnings are likely to overshadow April’s PPI report.
Atlassian Fundamental Analysis
Atlassian is a proprietary software company specializing in collaboration tools for software development and project management. It employs over 12,000 people in 14 countries and serves more than 300,000 customers across 200 countries.
So, why am I bullish on TEAM following its massive earnings beat?
Atlassian reported revenues of $1.79 billion, ahead of estimates calling for $1.70 billion, and earnings per share of $1.75, beating expectations of $1.33, while raising its full-year revenue guidance. I remain bullish amid nearly 30% year-over-year growth in its cloud and service collection segments. Its Rovo AI platform delivers 20% month-over-month credit usage growth, while its Teamwork Collection reports 10x more AI credit growth, which fuels cross-selling with net revenue retention (NRR) above 120%.
Metric | Value | Verdict |
P/E Ratio | 14.01 | Bullish |
P/B Ratio | 26.44 | Bearish |
PEG Ratio | 0.70 | Bullish |
Current Ratio | 0.70 | Bearish |
ROIC-WACC Ratio | Negative | Bearish |
Atlassian Fundamental Analysis Snapshot
The forward price-to-earnings (P/E) ratio of 14.01 makes TEAM an inexpensive stock. By comparison, the P/E ratio for the NASDAQ 100 Index is 38.57.
The average analyst price target for TEAM is $143.18. This suggests excellent upside potential with manageable downside risks.
Atlassian Technical Analysis
Today’s TEAM Signal
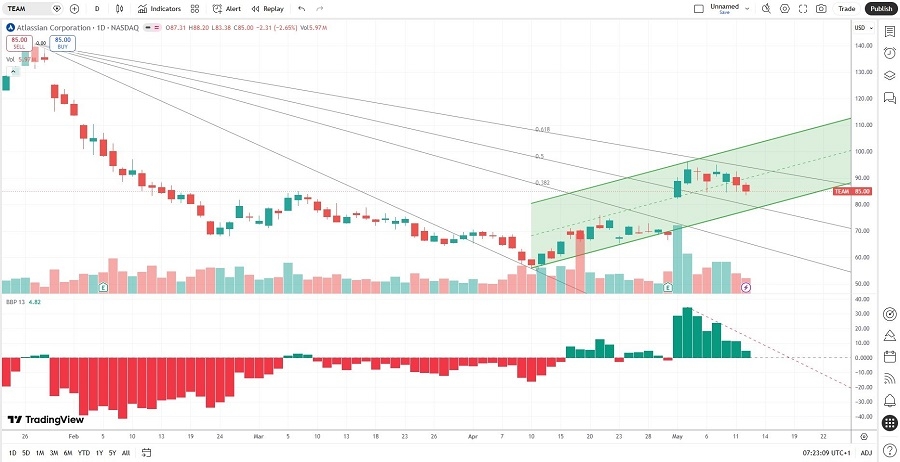
Atlassian Price Chart
The TEAM D1 chart shows price action inside a bullish price channel.
It also shows price action between its descending 50.0% and 61.8% Fibonacci Retracement Fan levels.
The Bull Bear Power Indicator is bullish with a descending trendline, suggesting more short-term volatility potential.
The average bullish trading volumes are higher than the average bearish trading volumes.
TEAM rallied more than the NASDAQ 100 Index, a bullish confirmation.
My TEAM Long Stock Trade
TEAM Entry Level: Between $82.05 and $88.20
TEAM Take Profit: Between $140.68 and $150.50
TEAM Stop Loss: Between $53.21 and $56.01
Risk/Reward Ratio: 2.03
Ready to trade our analysis of Atlassian? Here is our list of the best stockbrokers worth reviewing.