
Long Trade Idea
Enter your long position between $50.19 (the lower band of its horizontal support zone) and $52.44 (the upper band of its horizontal support zone).
Market Index Analysis
Cognizant (NASDAQ:CTSH) is a member of the NASDAQ 100 Index and the S&P 500 Index.
Both indices have recorded new all-time highs.
The Bull Bear Power Indicator for the NASDAQ 100 Index remains bullish with a negative divergence.
Market Sentiment Analysis
Oil prices remain elevated, which is slowly fueling higher inflation for longer. Markets will receive fresh inflation data this week as earnings season slowly winds down. It has created bubble-like conditions led by semiconductors, worse than the Dot-Com bubble.
Cognizant Fundamental Analysis
Cognizant is an IT consulting and outsourcing company. Its vertical business units focus on banking and financial services, insurance, healthcare, manufacturing, and retail. Its horizontal business units specialize in analytics, mobile computing, BPO, and testing.
So, why am I bullish on CTSH despite its post-earnings slide?
Cognizant reported revenues of $5.41 billion, matching expectations, while beating the earnings per share forecast of $1.34, reporting $1.40. I remain bullish amid its ongoing AI and digital transformation, and its 15,000 job cuts reinforce my bullish stance. CTSH boosted its dividend by 6.5% to $0.33 per share and announced $1.6 billion in planned shareholder returns, confirming management’s confidence in its current trajectory.
Metric | Value | Verdict |
P/E Ratio | 11.21 | Bullish |
P/B Ratio | 1.62 | Bullish |
PEG Ratio | 0.85 | Bullish |
Current Ratio | 2.23 | Bullish |
ROIC-WACC Ratio | Positive | Bullish |
Cognizant Fundamental Analysis Snapshot
The price-to-earnings (P/E) ratio of 11.21 makes CTSH an inexpensive stock. By comparison, the P/E ratio for the NASDAQ 100 Index is 38.15.
The average analyst’s price target for CTSH is $73.98. This suggests excellent upside potential with decreasing downside risks.
Cognizant Technical Analysis
Today’s CTSH Signal
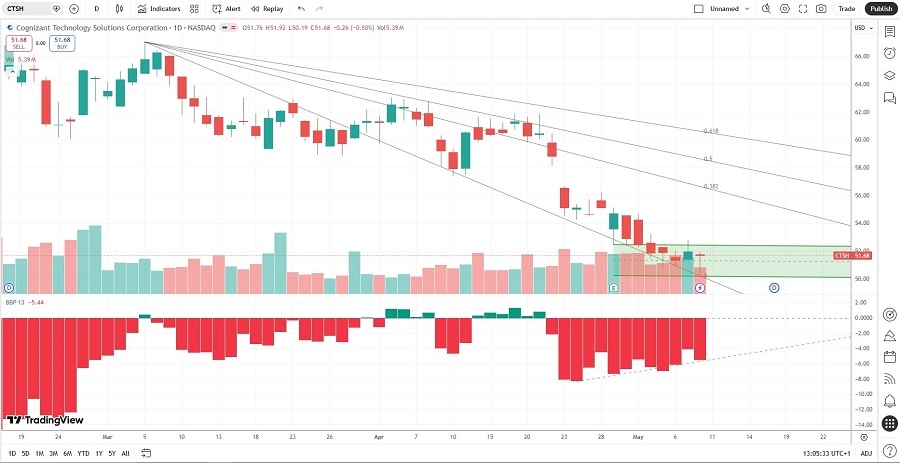
Cognizant Price Chart
The CTSH D1 chart shows price action inside a horizontal support zone.
It also shows price action between its descending 0.0% and 38.2% Fibonacci Retracement Fan levels.
The Bull Bear Power Indicator is bearish with a positive divergence.
The average bearish trading volumes are higher than the average bullish trading volumes, hinting at more short-term volatility potential.
CTSH corrected as the NASDAQ 100 Index pushed higher, a bearish signal, but breakout catalysts are accumulating.
My CTSH Long Stock Trade
CTSH Entry Level: Between $50.19 and $52.44
CTSH Take Profit: Between $75.76 and $78.34
CTSH Stop Loss: Between $40.15 and $41.36
Risk/Reward Ratio: 2.55
Ready to trade our analysis of Cognizant? Here is our list of the best stockbrokers worth reviewing.