
Short Trade Idea
Enter your short position between $261.85 (the lower band of its horizontal resistance zone) and $272.40 (the upper band of its horizontal resistance zone).
Market Index Analysis
Generac Holdings (NYSE:GNRC) is a member of the S&P 500 Index.
This index has recorded a new all-time high.
The Bull Bear Power Indicator for the S&P 500 Index remains bullish with a negative divergence.
Market Sentiment Analysis
Equity futures are moving lower this morning after President Trump rejected Iran’s latest peace proposal as totally unacceptable, and Iran vowed to never bow to US demands. Oil prices remain elevated, which is slowly fueling higher inflation for longer. Markets will receive fresh inflation data this week as earnings season slowly winds down. This has created bubble-like conditions led by semiconductors, worse than the Dot-Com bubble.
Generac Holdings Fundamental Analysis
Generac Holdings is a Fortune 1000 American manufacturer of residential, light commercial, and industrial power systems with outputs ranging from 800 watts to 9 megawatts and has emerged as a critical AI infrastructure play.
So, why am I bearish on GNRC despite its post-earnings rally?
Generac Holdings reported revenues of $1.06 billion and earnings per share of $1.80, beating expectations of $1.05 billion and $1.33, respectively. Still, I turned bearish as it faces declining demand in its core markets, while trying to balance this with yet unmaterialized strength as an AI data center backup power generator. I am equally bearish on the stiff competition from Caterpillar and Cummins and remain wary on capital efficiency.
MGNRCic | Value | Verdict |
P/E Ratio | 83.93 | Bearish |
P/B Ratio | 5.93 | Bearish |
PEG Ratio | 1.12 | Bullish |
Current Ratio | 2.03 | Bullish |
ROIC-WACC Ratio | Negative | Bearish |
Generac Holdings Fundamental Analysis Snapshot
The price-to-earnings= (P/E) ratio of 83.93 makes GNRC an expensive stock. In comparison, the P/E ratio for the S&P 500 Index is 31.83.
The average analyst price target for GNRC is $272.40. This suggests negligible upside potential with high downside risks.
Generac Holdings Technical Analysis
Today’s GNRC Signal
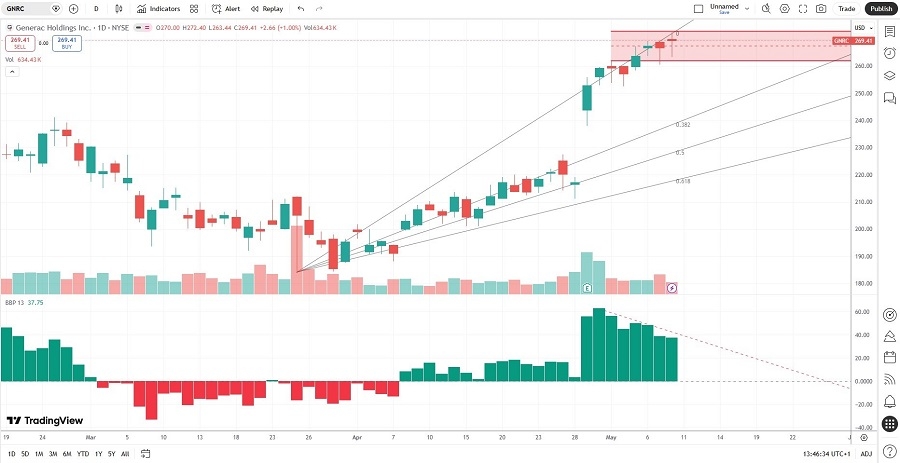
Generac Holdings Price Chart
The GNRC D1 chart shows price action potentially forming a new horizontal resistance zone.
It also shows price action between its ascending 0.0% and 38.2% Fibonacci Retracement Fan levels.
The Bull Bear Power Indicator is bullish with a negative divergence.
The average bearish trading volumes are higher than the average bullish trading volumes since the earnings beat.
GNRC rallied with the S&P 500 Index, a bullish confirmation, but bearish factors are dominant.
My GNRC Short Stock Trade
GNRC Entry Level: Between $261.85 and $272.40
GNRC Take Profit: Between $211.19 and $219.16
GNRC Stop Loss: Between $280.57 and $286.18
Risk/Reward Ratio: 2.71
Ready to trade our analysis of Generac Holdings? Here is our list of the best stockbrokers worth reviewing.