
Long Trade Idea
Enter your long position between $244.55 (an intermediate horizontal support level) and $251.78 (yesterday’s intra-day high).
Market Index Analysis
Humana (NYSE:HUM) is a member of the S&P 500 Index.
This index records all-time highs despite worsening macroeconomic issues.
The Bull Bear Power Indicator for the S&P 500 Index is bullish with a negative divergence.
Market Sentiment Analysis
Equity futures are moving higher and extending their record run amid optimism over tech earnings, but ARM Holdings sent jitters through markets amid chip supply concerns, while monitoring progress in the US-Iran peace process and ignoring macroeconomic issues from higher-for-longer oil prices, troubling consumer credit developments with auto loans the latest flashpoint, and market stability risks from private credit. Earnings from McDonald’s, Shake Shack, and Papa John’s will offer more consumer spending insights today.
Humana Fundamental Analysis
Humana is a health insurance company, the highest-ranked Kentucky company by revenues, and the fourth-largest US health insurance provider. It also manages TRICARE, a health care program of the US Department of Defense.
So, why am I bullish on HUM amid its post-earnings rally?
Humana beat revenue and earnings-per-share expectations of $39.7 billion and $10.25, respectively, reporting $39.65 billion and $10.31 per share. I remain bullish on Humana, driven by its expected 25% year-over-year increase in individual Medicare Advantage (MA) memberships, which could potentially make it the largest MA insurer in the US. I am equally bullish on the expansion of its CenterWell primary care platform and on margin expansion driven by its operational focus on efficiency, centralized transformation, and medical cost management.
Metric | Value | Verdict |
P/E Ratio | 26.32 | Bullish |
P/B Ratio | 1.59 | Bullish |
PEG Ratio | 1.40 | Bullish |
Current Ratio | 1.77 | Bearish |
ROIC-WACC Ratio | Positive | Bullish |
Humana Fundamental Analysis Snapshot
The price-to-earning (P/E) ratio of 26.32 makes HUM an inexpensive stock. By comparison, the P/E ratio for the S&P 500 Index is 31.66.
The average analyst price target for HUM is $240.50. This suggests no upside potential, but I see price action moving toward the high end of estimates at $333.00, while downside risks remain reasonable.
Humana Technical Analysis
Today’s HUM Signal
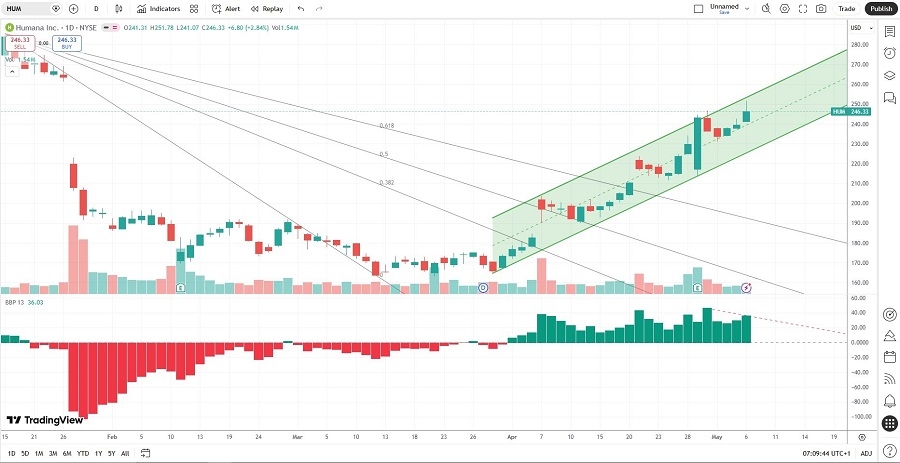
Humana Price Chart
The HUM D1 chart shows price action inside a bullish price channel.
It also shows price action breaking out above its descending Fibonacci Retracement Fan.
The Bull Bear Power Indicator is bullish with a negative divergence, suggesting more short-term volatility potential.
The average bullish trading volumes are higher than the average bearish trading volumes.
HUM advanced more than the S&P 500 Index, a significant bullish confirmation.
My HUM Long Stock Trade
HUM Entry Level: Between $244.55 and $251.78
HUM Take Profit: Between $315.35 and $324.18
HUM Stop Loss: Between $210.59 and $216.49
Risk/Reward Ratio: 2.09
Ready to trade our analysis of Humana? Here is our list of the best stockbrokers worth checking out.