


Long Trade Idea
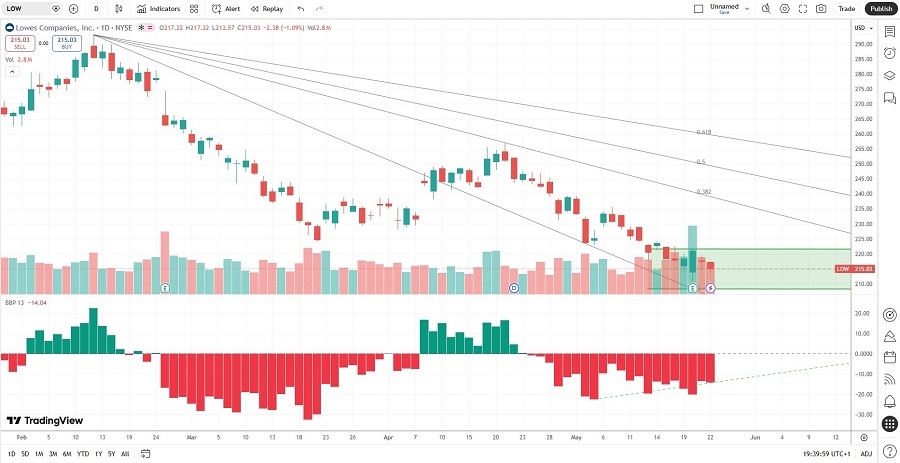
Enter your long position between $208.00 (the lower band of its horizontal support zone) and $217.22 (Friday’s intra-day high).
Market Index Analysis
Lowe’s (NYSE:LOW) is a member of the S&P 100 Index and the S&P 500 Index.
Both indices push towards fresh all-time highs, climbing a wall of worry driven by weak consumer spending and surging borrowing costs.
The Bull Bear Power Indicator for the S&P 500 Index is bullish with a negative divergence.
Market Sentiment Analysis
Equity futures are moving higher amid hopes for a peace deal between the US and Iran, but today’s strikes against Iran and claims by US President Trump that Iran will give up all its enriched uranium add to mixed signals and uncertainty. Oil prices tumbled, but price pressures on consumers are expected to remain, as non-energy components have added to inflation. In the meantime, the AI bubble keeps equities pushing higher.
Top Regulated Brokers
Lowe’s Fundamental Analysis
Lowe’s is a home improvement retailer with over 1,750 stores across the US. It is the second-largest hardware store globally, trailing its rival Home Depot.
So, why am I bullish on LOW following its earnings release?
Lowe’s beat revenue and earnings-per-share expectations of $22.98 billion and $2.97, reporting $23.08 billion and $3.03, respectively, despite a challenging housing market and a decrease in retail spending for DIY projects. Still, its focus on the pro segment balances retail softness, valuations have decreased to attractive levels, and the integration of Foundation Building Materials (FBM) and Artisan Design Group (ADG) is expected to add $8 billion in 2026 revenues.
Metric | Value | Verdict |
P/E Ratio | 18.18 | Bullish |
P/B Ratio | Unavailable | Bearish |
PEG Ratio | 1.40 | Bullish |
Current Ratio | 1.09 | Bearish |
ROIC-WACC Ratio | Positive | Bullish |
Lowe’s Fundamental Analysis Snapshot
The price-to-earning (P/E) ratio of 18.18 makes LOW an inexpensive stock. By comparison, the P/E ratio for the S&P 500 Index is 32.19.
The average analyst price target for LOW is $263.30. This suggests good upside potential with manageable downside risks.
Lowe’s Technical Analysis
Today’s LOW Signal
Lowe’s Price Chart
The LOW D1 chart shows price action inside a horizontal support zone.
It also shows price action between its descending 0.0% and 38.2% Fibonacci Retracement Fan levels.
The Bull Bear Power Indicator is bearish with a positive divergence.
The average bullish trading volumes are higher than the average bearish trading volumes.
LOW corrected as the S&P 500 Index rallied, a bearish signal, but breakout catalysts are accumulating.
My LOW Long Stock Trade
LOW Entry Level: Between $208.00 and $217.22
LOW Take Profit: Between $262.67 and $274.19
LOW Stop Loss: Between $181.85 and $189.05
Risk/Reward Ratio: 2.09
Ready to trade our analysis of Lowe’s? Here is our list of the best stockbrokers worth checking out.