


Microsoft (NASDAQ: MSFT) delivered a double beat in its latest quarter, sending shares higher since its release. Still, investors should not ignore a troublesome development trend: spending is growing faster than profits, while margins are bending under the weight of the AI buildout. Is a counter-trend move around the corner?
The rally raises a question bulls prefer to avoid, but a clear divergence is forming. How much of Microsoft’s AI future is already priced in?
Top Regulated Brokers
Why Margin Compression and Azure Worries Are Worrisome Issues for Microsoft
Microsoft spending is growing faster than profits, leaving no room for execution error. Management confirmed that Azure demand continues to exceed supply, which sounds bullish until one considers the implications. Growth is now limited to capacity timing, and management confirmed that growth might be uneven, dependent on capacity availability and contract mix. It pauses our previous note, “Microsoft’s AI Payoff: Is Enterprise Adoption Finally Catching Up to the Hype?”
Most of the new capex is for short-lived hardware that depreciates quickly and requires replacement. The risk is that Azure growth slows as margin compressions widen, while depreciation happens either way. Can margins improve when only spending is guaranteed?
Core Microsoft Fundamentals and Technical Developments to Consider
Revenue rose 18% in Microsoft’s fiscal fourth quarter to $90 billion, and Azure’s growth rate clocked in at 43%. At the same time, capex hit a record $41 billion, of which nearly 66% is for short-lived assets. Free cash flow collapsed 23%, and gross margin slipped by 67%. Microsoft hiked its 2027 capex to between $255 billion and $260 billion. Did bulls run out of arguments to justify more gains?
Metric | Value | Verdict |
P/E Ratio | 28.04 | Bearish |
P/B Ratio | 8.49 | Bearish |
PEG Ratio | 1.65 | Bullish |
Current Ratio | 1.23 | Bearish |
Return on Assets | 14.09% | Bullish |
Return on Equity | 34.04% | Bullish |
Profit Margin | 40.31% | Bullish |
ROIC-WACC Ratio | Positive | Bullish |
Dividend Yield | 0.72% | Bearish |
Microsoft Fundamental Analysis Snapshot
Microsoft spiked post-earnings, but has now formed a horizontal resistance zone with rising bearish trading volumes. The Bull Bear Power Indicator turned bearish, and a negative divergence has formed. Is this a precursor for more downside?
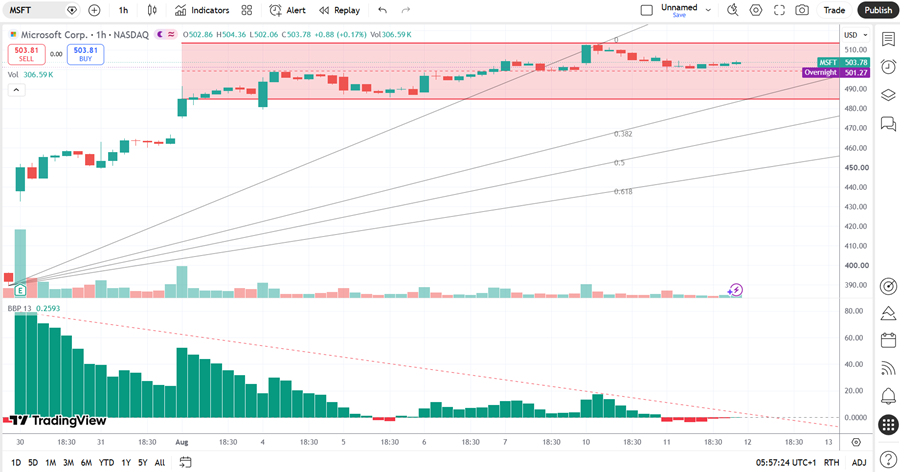
Microsoft Price Chart
Where Bulls Push Back and Why It May Not Hold
Bulls point to Azure crossing $100 billion in annual revenue, a $678 billion commercial backlog, and Copilot surpassing 30 million paid seats. While these are impressive stats, headline profit growth was inflated by a one-time $3.2 billion investment gain, while Microsoft guided 2027 operating margins to decrease further from 2026. Can shares handle ongoing AI infrastructure and R&D spending?
While bulls also argue that capacity constraints prove demand strength, bears counter that Microsoft fails to realize revenue today, while the capital racing to fix the shortage arrives just as growth comparisons turn brutal. If supply and demand finally balance, what supports the premium multiple?
What Today’s Setup Highlights About Market Sentiment
The average analyst price target of $567.20 suggests good upside potential, but downside risk has increased more than upside potential. Post-earnings momentum shows signs of slowing and is now vulnerable to a profit-taking sell-off. Are bears eying a sustained breakdown below $500 to force a correction?
Options markets confirm slowly changing sentiment, as implied volatility compressed into the high-20s since the earnings report, making downside protection cheap. The put/call volume ratio near 0.43 shows calls heavily outpacing puts. This one-sided bullish positioning often precedes pullbacks. Are investors hedging their exposure?
What’s Next for Microsoft’s AI-Driven Story
Is Microsoft’s record capex, margin compression, and fading bullish momentum setting up the next sell-off? Today’s session could see a breakdown below its horizontal resistance zone, but what if bulls take out $513.48?
My MSFT Short Trade for the Current Setup
MSFT Entry Level: Between $494.60 and $504.48
MSFT Take Profit: Between $424.26 and $432.44
MSFT Stop Loss: Between $529.23 and $534.96
Risk/Reward Ratio: 2.03
Ready to trade our stock market forecast and analysis? Here are the best CFD stocks brokers to choose from.