


Oracle (NYSE: ORCL) investors gear up for an early-September earnings report, but the focus is far from its database software business. Its aggressive transition into AI infrastructure has turned a cash-positive business into a capital-hungry AI story, and credit markets are saying so out loud. What story does the backlog hide?
This software giant started spending like a utility while its own executives sell stock at a historic pace. How much faith should investors place in the AI transition?
Top Regulated Brokers
Are Negative Free Cash Flow and Capital Intensity Creating an Issue for Oracle
Oracle used to be an asset-light software vendor slipping through the cracks of the AI revolution, but has transformed into an asset-heavy AI landlord. Therefore, capital spending now yields negative cash flow, as Oracle must finance data centers and wait years before converting customer contracts into revenue. While our previous note, “Oracle’s Multicloud AI Database Business Is Exploding: Does The Selloff Present a Generational Buying Opportunity?” continues to carry weight long-term, is a short-term price adjustment imminent?
Persistent cash burn, rising leverage, planned equity dilution, and a concentrated customer base can quietly convert an equity growth story into a credit story. Will demand yield results below the debt servicing cost?
Key Oracle Fundamental and Valuation Facts to Watch Today
Oracle fiscal 2026 capex clocked in at $55.7 billion, up 162% year-over-year, driving free cash flow to negative $23.7 billion. It also caused S&P to cut Oracle to BBB-, one notch above junk, projecting fiscal 2027 capex of $90–95 billion, negative cash of $42 billion, and $130 billion of borrowings. Meanwhile, CEO Safra Catz unloaded about $2.5 billion of stock in 2025, making her America’s top insider seller. Should investors follow suit?
Metric | Value | Verdict |
P/E Ratio | 25.18 | Bullish |
P/B Ratio | 11.28 | Bearish |
PEG Ratio | 0.83 | Bullish |
Current Ratio | 1.12 | Bearish |
Return on Assets | 6.50% | Bearish |
Return on Equity | 53.38% | Bullish |
Profit Margin | 25.38% | Bullish |
ROIC-WACC Ratio | Negtive | Bearish |
Dividend Yield | 1.36% | Bearish |
Oracle Fundamental Analysis Snapshot
Price action is challenging the upper band of its horizontal resistance zone, but average bearish trading volumes are higher than average bullish trading volumes. The Bull Bear Power Indicator is bullish, with a descending trendline. Will a bearish crossover follow?
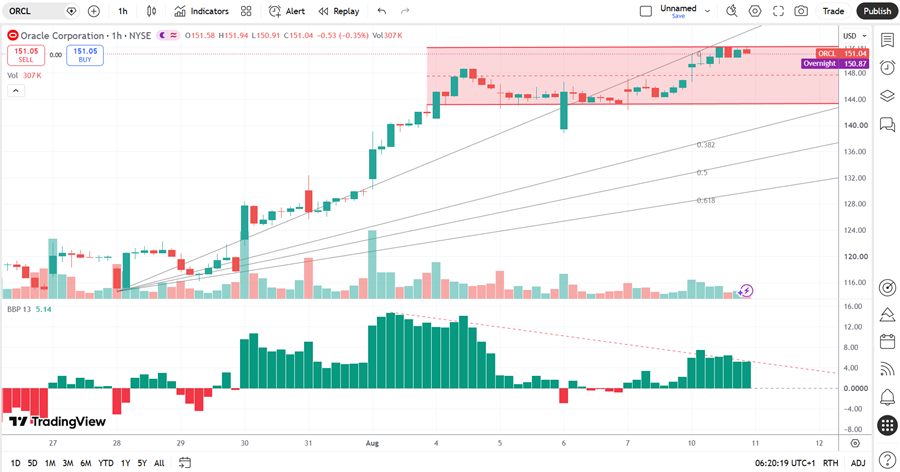
Oracle Price Chart
Where Bulls Push Back and Why It May Not Hold
Bulls defend their positions behind a $638 billion backlog and 17% revenue growth to $67.4 billion. They argue that capex is driving demand with a time delay, while management suggested that it may uncouple AI capex from Oracle’s capital requirements. Still, how much should investors trust a backlog that relies on one massive but unprofitable customer?
Bears counter that equity dilution continues with a $20 billion equity issuance later this year, while Oracle’s leverage has breached S&P’s downgrade triggers. Since Oracle depends on OpenAI, which creates a red flag on its own, what happens to the backlog, the bonds, and the multiple if OpenAI stumbles?
What Today’s Setup Highlights About Market Sentiment
The average price target of $247.17 suggests excellent upside potential, but downside risks have increased, magnified by Michael Burry’s reopened short. Is Wall Street too slow to reprice Oracle’s capital intensity?
Options markets confirm nervousness as Oracle’s 30-day at-the-money implied volatility reached 70%, with an IV rank of 62, while put open interest slightly outweighs calls at a ratio around 1.02. Front-month contracts price a one-standard-deviation move of roughly 20%, suggesting traders keep paying up for downside protection.
What’s Next for Oracle’s AI-Driven Story
How will bulls handle pressure near current levels with short-term downside catalysts rising? Today’s session could see another breakout attempt, but what if bears reclaim $138.77?
My ORCL Short Trade for the Current Setup
ORCL Entry Level: Between $146.61 and $154.48
ORCL Take Profit: Between $120.00 and $125.71
ORCL Stop Loss: Between $159.42 and $165.76
Risk/Reward Ratio: 2.08
Ready to trade our stock market forecast and analysis? Here are the best CFD stocks brokers to choose from.