


Tesla (NASDAQ: TSLA) delivered one of the strongest operational quarters in its history, but investors initially abandoned Tesla following its earnings release as they focused on surging AI capex. Bears called the spending undisciplined, while bulls saw a company reinvesting at a record pace. Can the post-earnings recovery continue?
Top Regulated Brokers
After bulls stepped in, bears should question whether they punished Tesla for the capex that could define its next decade. Will bears finally throw in the towel?
Why AI Infrastructure and Energy Expansion Could Be Tailwinds for Tesla
Tesla announced record vehicle deliveries, calming fears that demand concerns were temporary. Full Self-Driving matured from an optional add-on into a demand driver, with management noting that customers started to buy the software with the car rather than the other way around. It expands on our bullish note, “Tesla’s German Rebound Meets Q2 Earnings: Is the Street Underestimating This Setup?”
While Tesla is spending its capex on AI data centers, they power autonomy, Robotaxi, and Optimus. Tesla’s energy division rides the same infrastructure wave, since every new data center needs storage. With the on-schedule Megapack 3 and Megablock upgrades to the Texas Megafactory, is it time for investors to reevaluate capex as an earnings catalyst, which could extend the post-earnings recovery?
Key Tesla Fundamental and Valuation Facts to Watch Today
Record deliveries of 480,126 vehicles in the second quarter, up 25% year-over-year, drove revenues up 26% to $28.2 billion. Active FSD subscriptions surged 56% to 1.48 million, while energy storage deployments climbed 41% to 13.5 GWh. Services revenue jumped 50% to a record $4.58 billion. Shares have recovered from their post-earnings dip. Is Wall Street buying into the growth momentum?
Metric | Value | Verdict |
P/E Ratio | 305.33 | Bearish |
P/B Ratio | 15.05 | Bearish |
PEG Ratio | 4.85 | Bearish |
Current Ratio | 1.94 | Bullish |
Return on Assets | 1.93% | Bearish |
Return on Equity | 4.67% | Bearish |
Profit Margin | 3.67% | Bearish |
ROIC-WACC Ratio | Negative | Bearish |
Dividend Yield | 0.00% | Bearish |
Tesla Fundamental Analysis Snapshot
Price action is recovering from its post-earnings drop within a bullish price channel. The Bull Bear Power Indicator is bullish, but a descending trendline has formed. Is bullish sentiment enough to march forward, supported by rising bullish trading volumes?
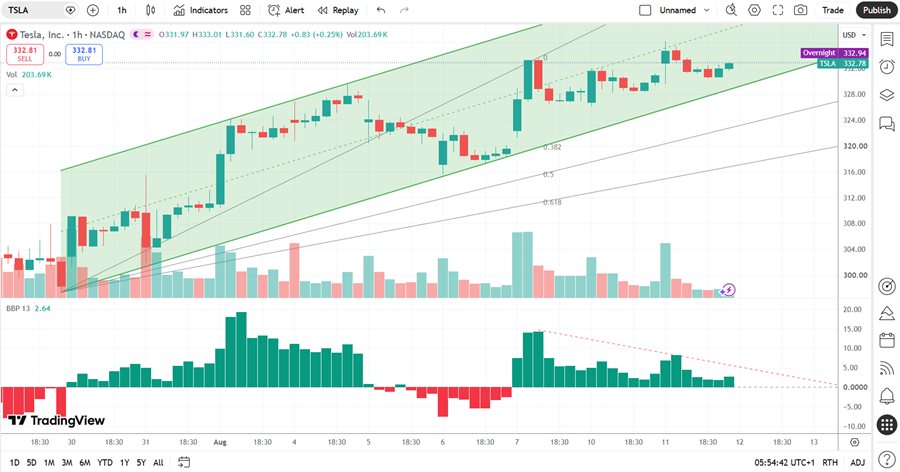
Tesla Price Chart
Where Bears Push Back and Why It May Not Hold
Bears correctly highlight the weak spot in the earnings release, with adjusted EPS of $0.33 well below consensus estimates of $0.51. Capex doubled in the quarter, which yielded negative free cash flow of $1.1 billion. Still, investors should consider Tesla’s management comments, stating that this year is a deliberate, massive capex year. Could these investments lay the foundation for the best returns in the company’s history?
Bulls argue that Tesla’s balance sheet is self-funding the buildout. At the same time, the shift toward margin-rich FSD software will lift overall profitability, especially with approvals across Europe and Asia coming in. How long can bears blame capex if Tesla continues to set new demand records?
What Today’s Setup Highlights About Market Sentiment
The average analyst price target of $396.62 suggests excellent upside potential, and downside risk is decreasing. Record deliveries, accelerating FSD adoption, and Megapack 3’s launch give bulls fundamental catalysts. Can they drive price action to the price target?
Options markets are cautiously optimistic. Implied volatility dipped to the high 40s since the earnings release. Therefore, calls are cheaper to own, and call volume has edged ahead of puts. Growing open interest at strikes above the market into September expirations suggests traders expect more upside from current levels.
What’s Next for Tesla’s AI-Driven Story
Is capex clarity the only missing ingredient? Today’s session could ride the bullish price channel higher, but what happens if bears force a close below $317.27?
My TSLA Long Trade for the Current Setup
TSLA Entry Level: Between $329.53 and $336.20
TSLA Take Profit: Between $369.44 and $375.20
TSLA Stop Loss: Between $310.44 and $315.53
Risk/Reward Ratio: 2.09
Ready to trade our stock market forecast and analysis? Here are the best CFD stocks brokers to choose from.