


The NASDAQ 100 continues to see a lot of noise, as we are looking at the interest rate situation continues to cause a bit of trouble for risk appetite-based assets.
The NASDAQ 100 has fallen pretty significantly during the early part of the trading session. The 30,000 level is an area that has been both support and resistance.
Top Regulated Brokers
Ultimately, this is a market that I believe continues to see a lot of the inflationary problems causing issues here. The inflationary problems, of course, are coming out of the energy sector and the reality that energy is not going to be free-flowing. If that is going to be the case, then that causes the central bank perhaps to tighten because of that inflation, and it opens up the possibility of the bond market really getting out of hand.
The 30,000 level needs to hold as support
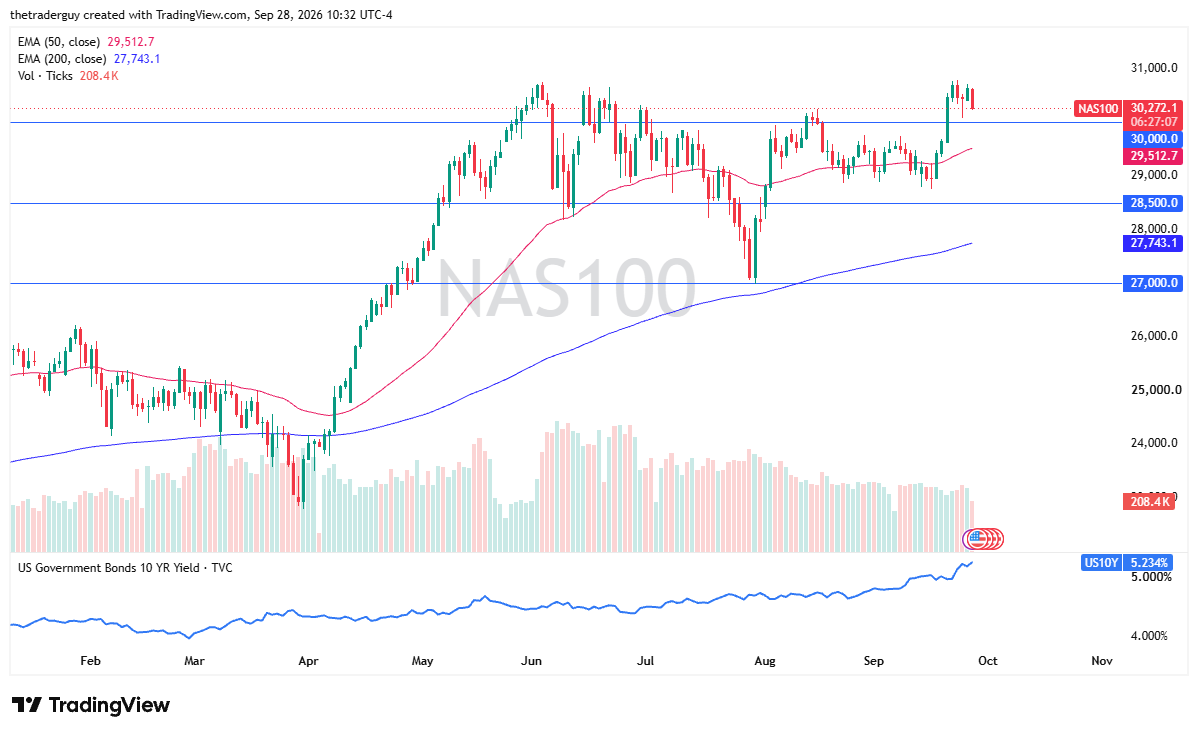
We have seen quite a bit of momentum to the upside when it comes to rates, and that has not changed. Now, the 30,000 level needs to hold as support. If it does not, then the 50-day EMA comes into the picture.
On the other hand, though, I do think this is a market that more than likely will be one that looks for a certain amount of a bounce, offering value, and traders will continue to jump into it. Based on the AI trade, as long as that remains somewhat feasible, then the NASDAQ 100 will continue to attract a certain amount of attention.
Despite the fact that the candlestick is pretty ugly for the day, when you look at the totality of the market, we just tagged the top of the overall range for the second half of the year and pulled back. If you did not know anything about the interest rates right now, this would look like a typical chart, quite frankly.
Ready to trade our stock market forecast and analysis? Here are the best CFD stocks brokers to choose from.